Five-Number Summary and Box Plot
Install and import#
npm install fintech-algorithmsimport { fiveNumberSummaryAndBoxPlot } from "fintech-algorithms/foundations/location-ranking-and-exploratory-summaries/five-number-summary-and-box-plot";Signature#
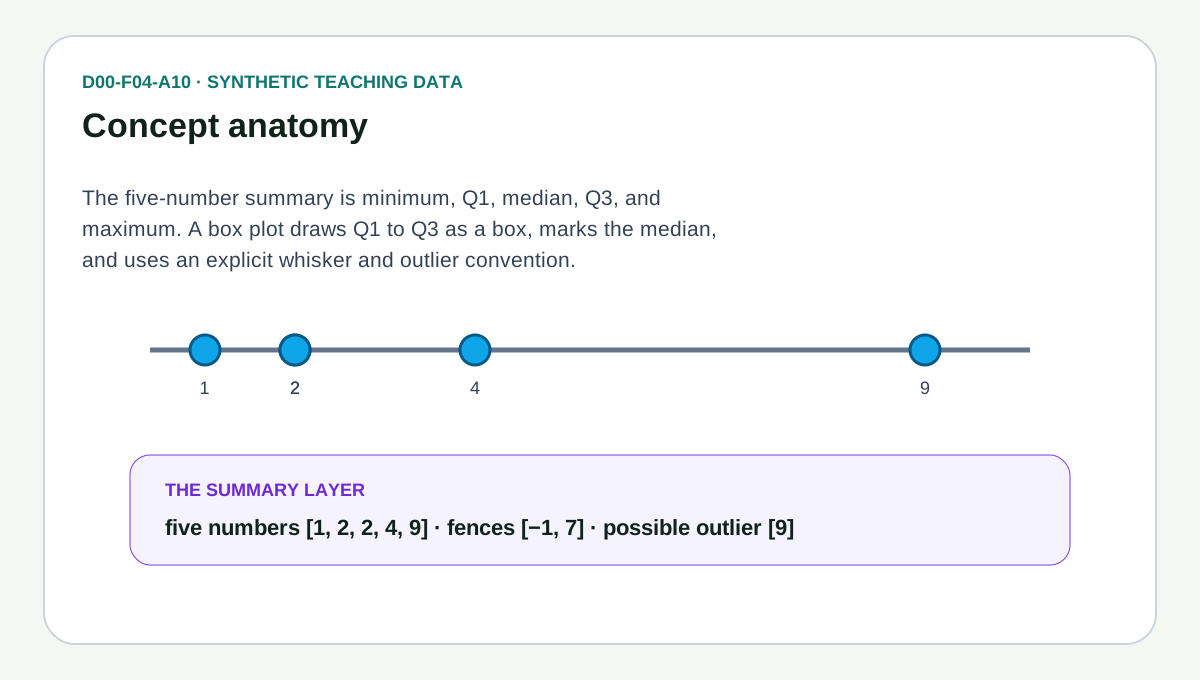
fiveNumberSummaryAndBoxPlot(input)Produces the minimum, three quartiles, and maximum of a numeric series, the Tukey 1.5-IQR fences drawn from them, and the observations lying outside those fences.
Parameters#
| Name | Type | Notes |
|---|---|---|
input | { values: number[] } | The observations to summarise, under the key values. Quartiles use linear interpolation between neighbouring order statistics. |
Returns#
{ fiveNumberSummary: number[]; fences: [number, number]; outliers: number[] }
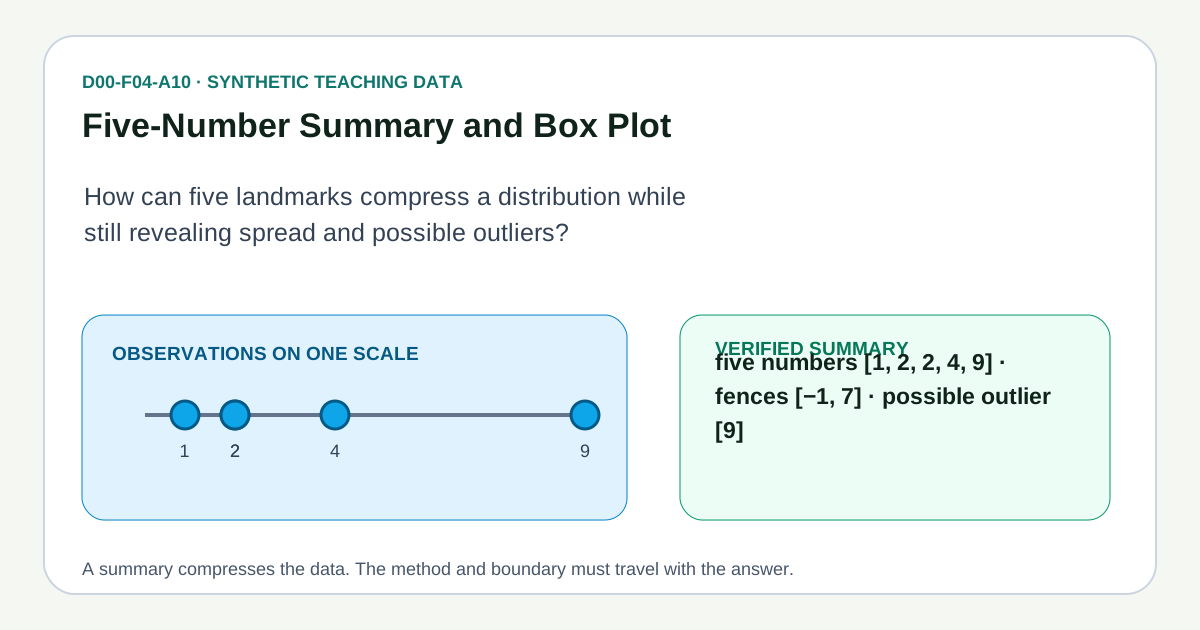
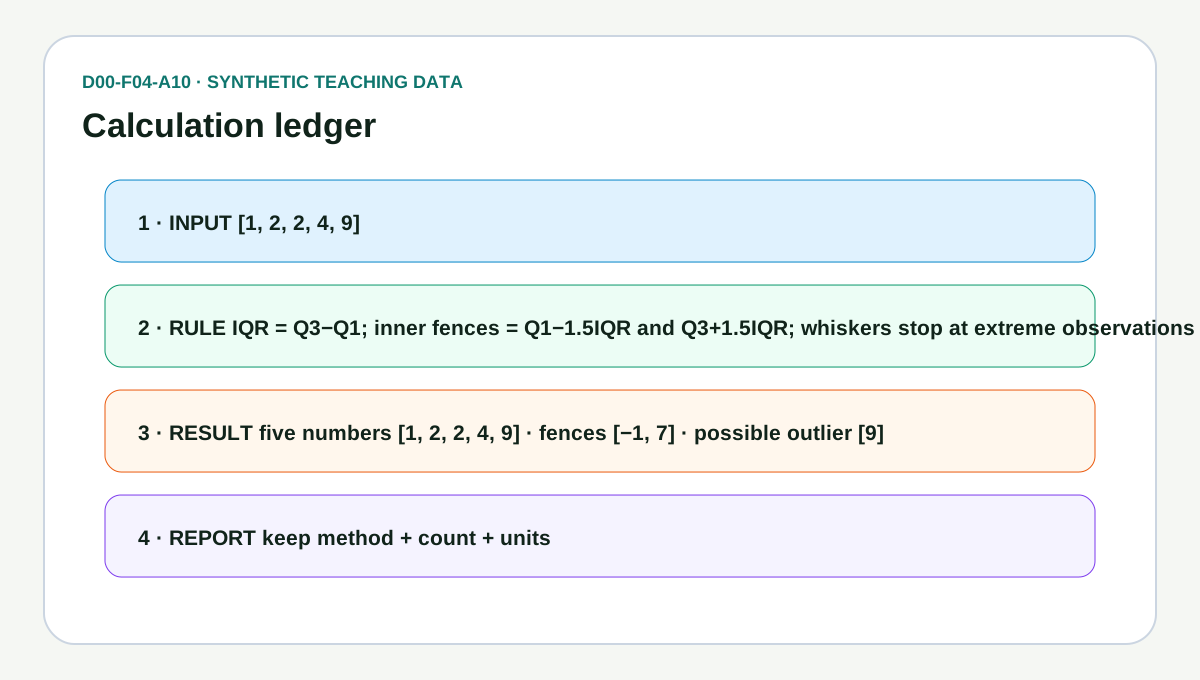
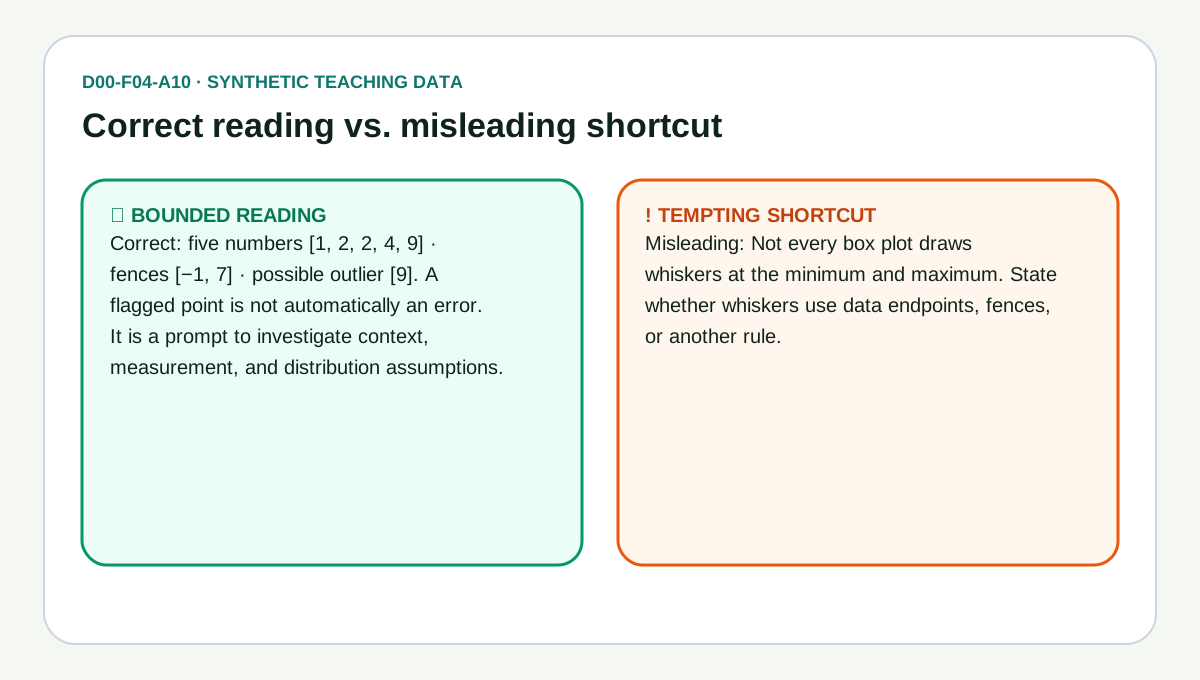
fiveNumberSummary is [minimum, q1, median, q3, maximum], fences is [q1 - 1.5 * iqr, q3 + 1.5 * iqr], and outliers lists the observations strictly outside the fences in the caller's original order.
Errors#
- When
inputis null, an array, or not an object — throws TypeError - When
valuesis missing, is not an array, or is empty — throws RangeError - When any entry of
valuesdoes not coerce to a finite number — throws RangeError
Complexity: time O(n log n),
space O(n).
Worked example#
verified This is the worked example published in the article, replayed by the test suite on every run. The output cannot drift.
Input#
{
  "values": [1, 2, 2, 4, 9],
  "weights": [1, 1, 2, 1, 1],
  "trimProportion": 0.2,
  "bins": 4
}Call#
fiveNumberSummaryAndBoxPlot(input)Returns#
object with 2 fields: fiveNumberSummary, fences
{
  "fiveNumberSummary": [1, 2, 2, 4, 9],
  "fences": [-1, 7]
}Diagrams#
Calculation flow#
Reasoning flow — D00-F04-A10
flowchart LR
    A["Finite observations"] --> B["Name units and scope"]
    B --> C["Freeze: IQR = Q3−Q1; inner fences = Q1−1.5IQR and Q3+1.5IQR; whiskers stop at extreme observations within fences"]
    C --> D["Calculate full precision"]
    D --> E{"Boundary satisfied?"}
    E -->|Yes| F["Report five numbers [1, 2, 2, 4, 9] · fences [−1, 7] · possible outlier [9]"]
    E -->|No| G["Abstain and repair contract"]
    F --> H["Pair with distribution context"]
How it works#
This page states the contract — how to call it correctly. The article explains the concept: why it works, and where it breaks.
References#
- Box Plot
- Percentile Definitions
- Historical-example decision