Robust Trendline Fitting
Install and import#
npm install fintech-algorithmsimport { fitRobustTrendline } from "fintech-algorithms/geometric-chart-patterns/pivots-and-levels/robust-trendline-fitting";Signature#
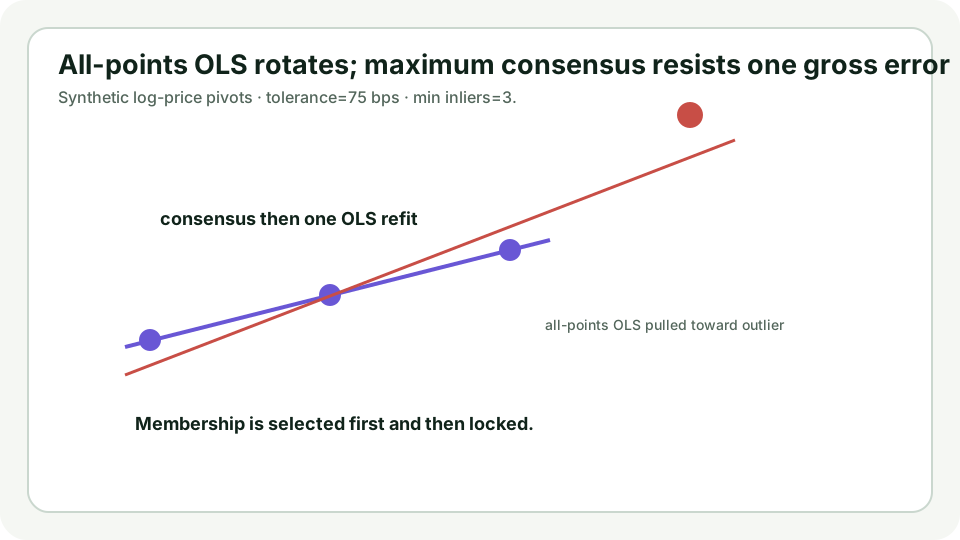
fitRobustTrendline(pivots, kind, toleranceBps, minInliers, maxPoints, projectionIndex)Fits a trendline through pivots in log space with outlier resistance. Log space matters: a straight line in price implies a constant *dollar* change per bar, which is not what a trend on a long chart means.
Parameters#
| Name | Type | Notes |
|---|---|---|
pivots | Pivot[] | Pivots to fit through. |
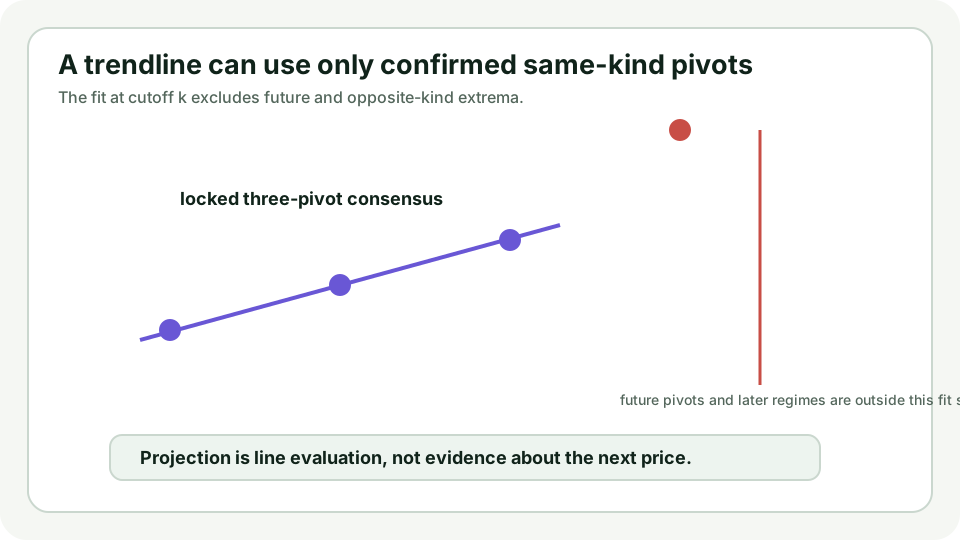
kind | "support" | "resistance" | Which side to fit, which decides how violations are treated. |
toleranceBps | number | How far a pivot may sit from the line and still count as an inlier. min: 0 |
minInliers | number | Minimum inliers for the fit to be accepted. min: 2 · integer: true |
maxPoints | number | Cap on pivots considered, bounding the search. min: 2 · integer: true |
projectionIndex | number | Bar index to project the fitted line to. Defaults to one past the highest pivot index, so the line is extended a single bar beyond its support. optional |
Returns#
{ kind, slope_log_per_bar, intercept_log, projected_index, projected_price, inlier_count, … }
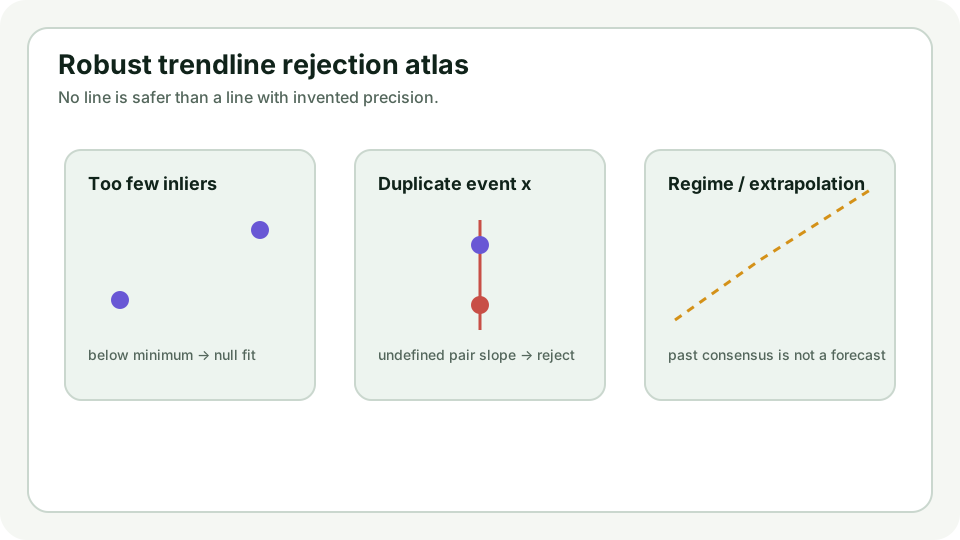
The fit in log space plus its projection in price, with the inlier count — a two-point 'trendline' is arithmetic, not evidence.
Errors#
- When fewer pivots are supplied than minInliers — throws
Complexity: time O(points²),
space O(points).
Worked example#
verified This is the worked example published in the article, replayed by the test suite on every run. The output cannot drift.
Input#
[
  {
    "kind": "low",
    "event_index": 0,
    "confirmation_index": 2,
    "price": 99.48431564193378
  },
  {
    "kind": "low",
    "event_index": 10,
    "confirmation_index": 12,
    "price": 109.94717245212352
  },
  {
    "kind": "low",
    "event_index": 20,
    "confirmation_index": 22,
    "price": 121.51041751873485
  }
]
Showing 3 of 4 elements.
"low"50312undefinedCall#
fitRobustTrendline(pivots, kind, toleranceBps, minInliers, maxPoints, projectionIndex)Returns#
object with 10 fields: kind, slope_log_per_bar, intercept_log, projected_index, projected_price, inlier_count, outlier_count, median_absolute_residual_bps, …
{
  "kind": "low",
  "slope_log_per_bar": 0.010000000000000009,
  "intercept_log": 4.6,
  "projected_index": 31,
  "projected_price": 135.63941440846523,
  "inlier_count": 3,
  "outlier_count": 1,
  "median_absolute_residual_bps": 0,
  "inlier_event_indexes": [0, 10, 20],
  "source_pivot_count": 4
}
Other exports#
This module also exports
detectCausalPivots. Every module additionally exports run as an alias of its
primary function, and a meta object carrying its catalog id, domain, family,
shape and article URL.
Diagrams#
Calculation flow#
Robust Trendline Fitting calculation flow
flowchart LR
    A["Confirmed same-kind pivots"] --> B["Validate clocks, unique event indexes, and positive prices"]
    B --> C["Keep most recent max points; transform to log price"]
    C --> D["Enumerate every two-point hypothesis"]
    D --> E["Build inclusive residual consensus"]
    E --> F["Score: count, median residual, slope magnitude, pair order"]
    F --> G{"Enough inliers?"}
    G -- "no" --> H["No fit"]
    G -- "yes" --> I["Lock winning membership"]
    I --> J["One OLS refit and exact residual-bps diagnostics"]
How it works#
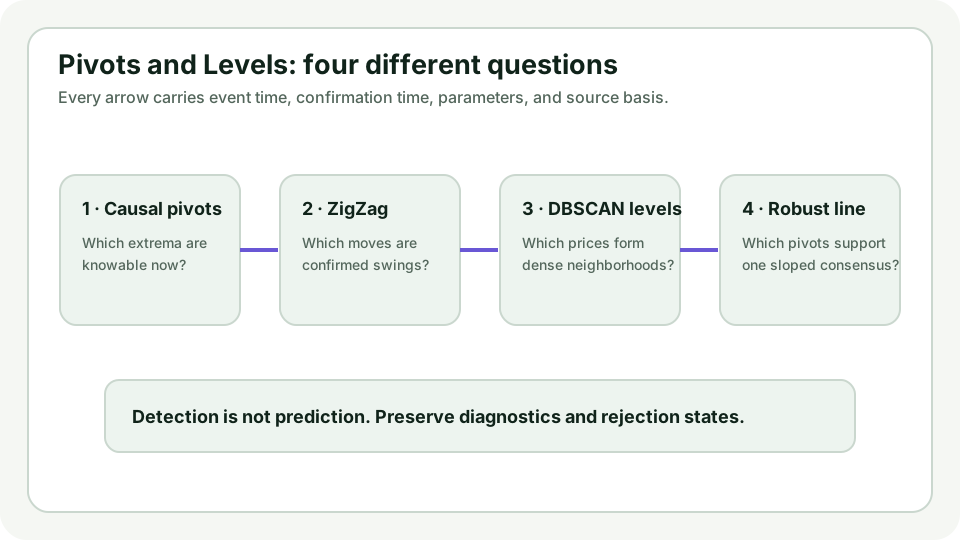
This page states the contract — how to call it correctly. The article explains the concept: why it works, and where it breaks.
References#
- Random Sample Consensus: A Paradigm for Model Fitting — Martin A. Fischler and Robert C. Bolles
- sklearn.linear_model.RANSACRegressor — scikit-learn project
- Linear Least Squares Regression — NIST/SEMATECH
- Pine Script Concepts: Repainting — TradingView