Cross-Sectional, Time-Series, Panel, and Event Data
Install and import#
npm install fintech-algorithmsimport { crossSectionalTimeSeriesPanelAndEventData } from "fintech-algorithms/foundations/data-variables-samples-and-measurement/cross-sectional-time-series-panel-and-event-data";Signature#
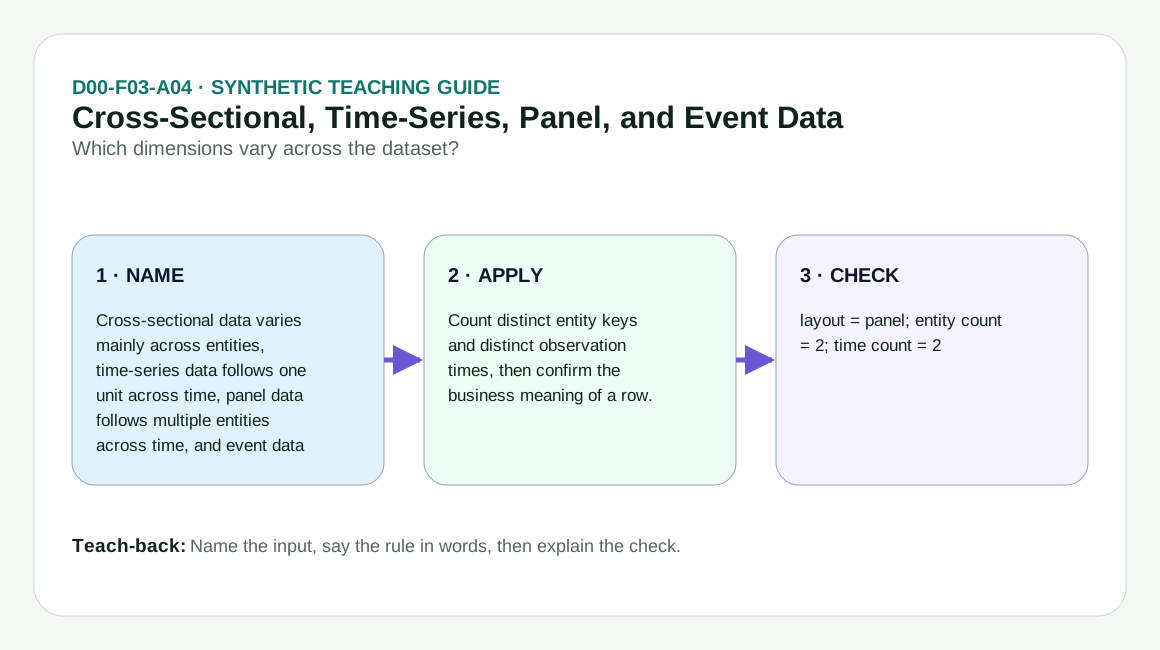
crossSectionalTimeSeriesPanelAndEventData(input)Infers a table's layout from the shape of its own keys, deciding whether the rows are cross-sectional, a time series, a panel, or event records.
Parameters#
| Name | Type | Notes |
|---|---|---|
input | D00Input | A plain object. Every F03 topic first reads rows, which must be a non-empty array of row objects, and derives the sorted union of every key seen across them before any per-topic branch runs. This topic reads each row's entity and timestamp fields and checks whether an event key is present on any row. |
Returns#
{ layout: string; entityCount: number; timeCount: number }
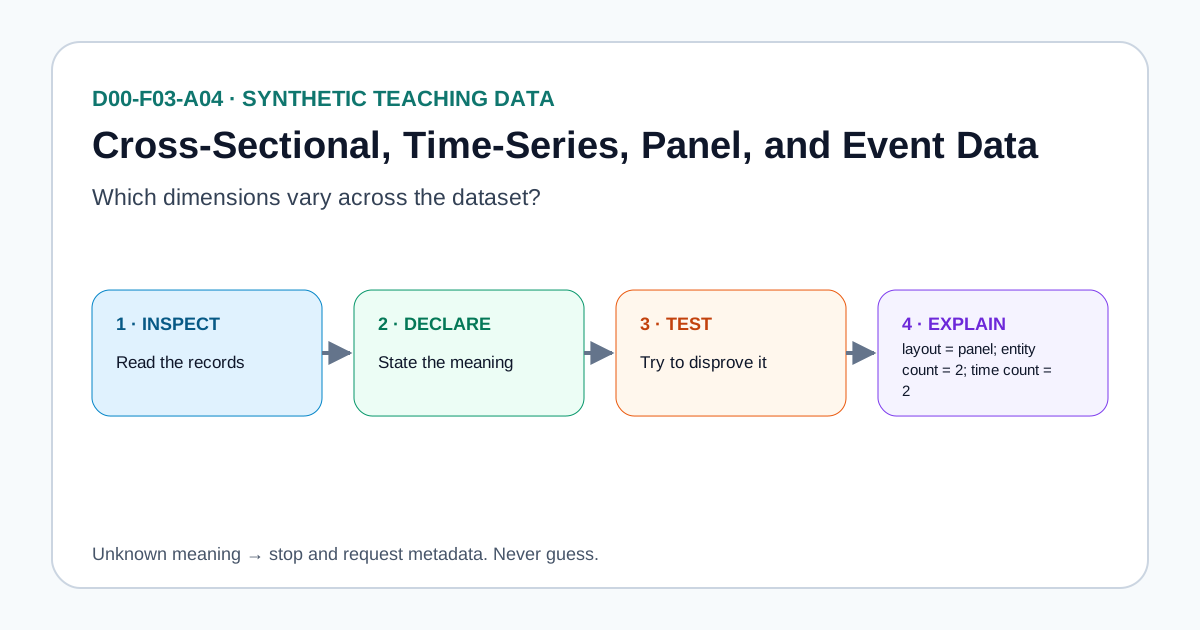
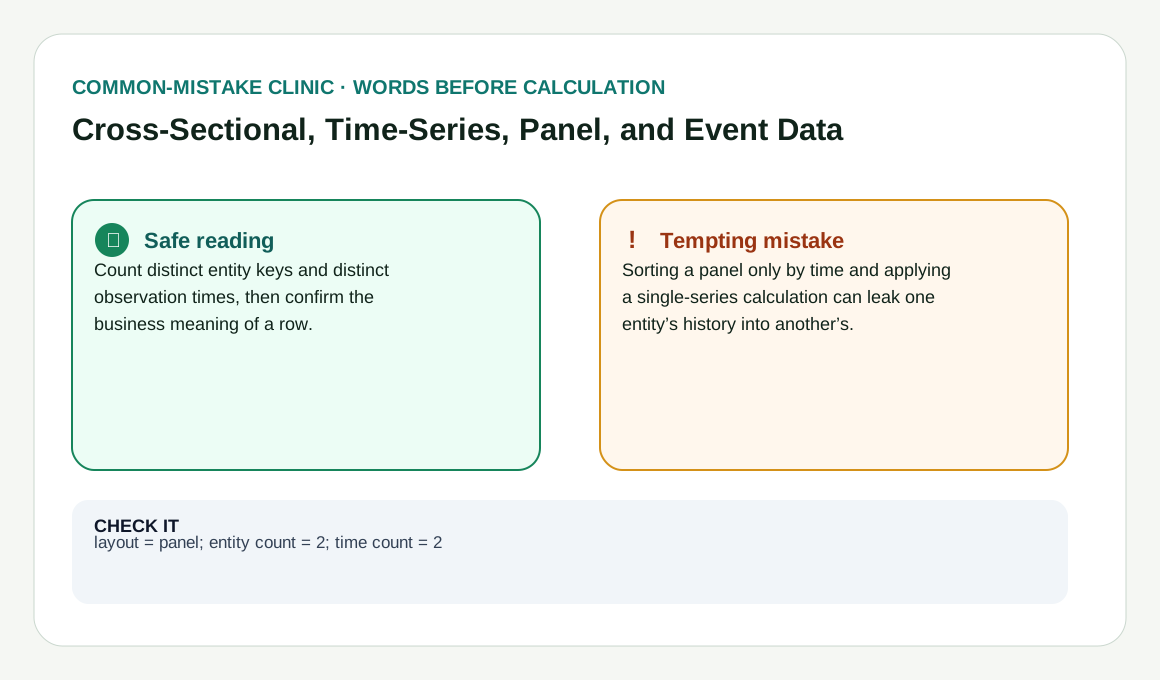
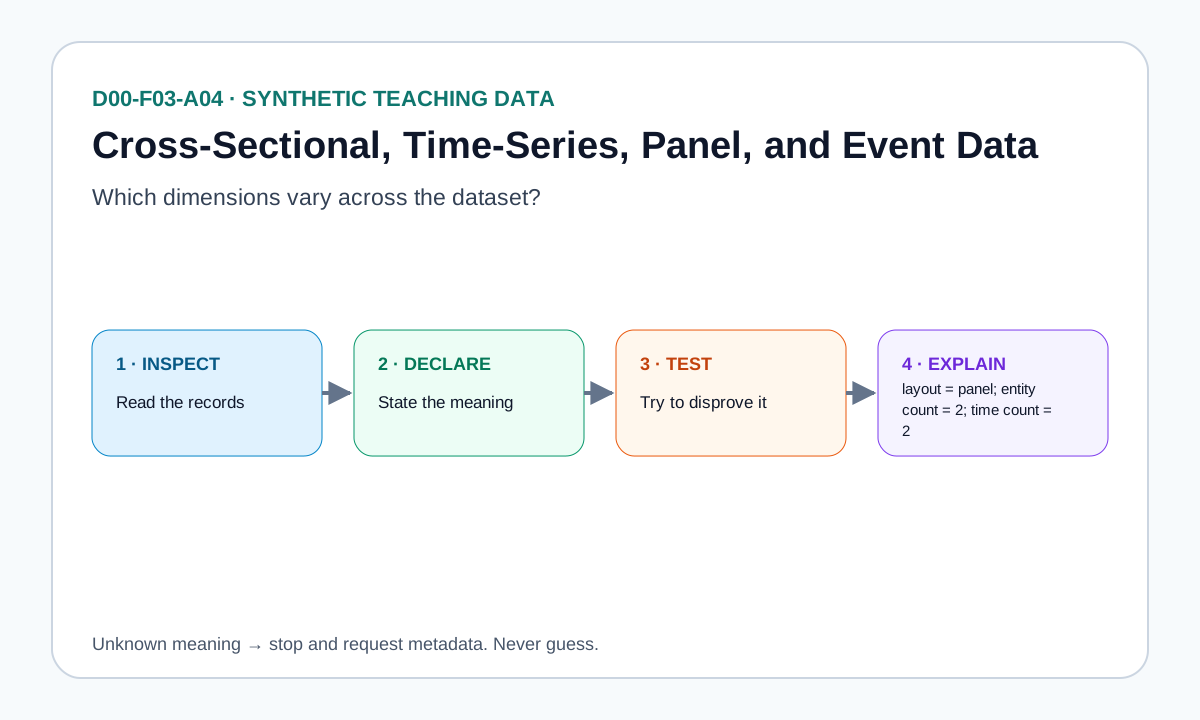
layout is panel when both entities and timestamps vary, time-series when only timestamps do, and cross-sectional otherwise; the presence of an event key on any row overrides all three with event. That override is a presence test only: the key's value is never inspected, so a null event value still yields event, and the semantic question of whether the column records occurrences is left to the reader. entityCount and timeCount are the distinct counts behind that decision.
Errors#
- When input is not a plain object — throws TypeError
- When rows is missing, empty, or not an array — throws RangeError
Complexity: time O(r * c),
space O(r * c).
Worked example#
verified This is the worked example published in the article, replayed by the test suite on every run. The output cannot drift.
Input#
{
  "rows": [
    {
      "entity": "A",
      "timestamp": "2025-01-01T00:00:00Z",
      "value": 10,
      "rating": "low"
    },
    {
      "entity": "A",
      "timestamp": "2025-01-02T00:00:00Z",
      "value": null,
      "rating": "medium",
      "censored": true
    },
    {
      "entity": "B",
      "timestamp": "2025-01-01T00:00:00Z",
      "value": 12,
      "rating": "high"
    }
  ],
  "ordinalColumns": ["rating"],
  "populationSize": 100,
  "frameSize": 80,
  "keyColumns": ["entity", "timestamp"],
  "truncationRule": "values below 5 excluded",
  "measurements": [9.9, 10, 10.1, 10],
  "referenceValue": 10,
  "vintages": [
    {
      "availableAt": "2025-02-01T00:00:00Z",
      "value": 100
    },
    {
      "availableAt": "2025-03-01T00:00:00Z",
      "value": 102
    },
    {
      "availableAt": "2025-04-01T00:00:00Z",
      "value": 101
    }
  ],
  "asOf": "2025-03-15T00:00:00Z",
  "provenance": {
    "source": "teaching.csv",
    "owner": "Fintech Builder",
    "license": "CC-BY-4.0",
    "retrievedAt": "2026-08-10",
    "transformations": ["parse", "validate"]
  }
}Call#
crossSectionalTimeSeriesPanelAndEventData(input)Returns#
object with 2 fields: layout, entityCount
{
  "layout": "panel",
  "entityCount": 2
}Diagrams#
Calculation flow#
Concept flow — D00-F03-A04
flowchart LR
    A["Synthetic records"] --> B["Declare meaning"]
    B --> C["Run diagnostic"]
    C --> D{"Assumption survives?"}
    D -->|Yes| E["Explain: layout = panel; entity count = 2; time count = 2"]
    D -->|No| F["Stop and repair metadata"]
How it works#
This page states the contract — how to call it correctly. The article explains the concept: why it works, and where it breaks.
References#
- Time Series and Date Functionality
- 2. W3C Data on the Web Best Practices
- Evidence boundary