Cumulative TICK
Install and import#
npm install fintech-algorithmsimport { calculate } from "fintech-algorithms/market-breadth-and-internals/thrust-and-pressure/cumulative-tick";Signature#
calculate(rows, seed, intervalSeconds)Accumulates the net count of issues trading on an uptick versus a downtick. An intraday pressure gauge — it measures the balance of buying and selling *urgency* within the session rather than the outcome at the close.
Parameters#
| Name | Type | Notes |
|---|---|---|
rows | TickRow[] | Intraday observations of uptick, downtick and neutral issue counts. Rows carry a ready flag; a row that is not ready is excluded rather than treated as zero, because a missing count and a count of zero mean opposite things about market breadth. |
seed | number | Starting value of the accumulation. |
intervalSeconds | number | Sampling interval of the observations, recorded so a series sampled at one rate is not compared with one sampled at another. min: 1 |
Returns#
{ status, value, interval_seconds, series }
The cumulative series with the interval it was sampled at.
Errors#
- When intervalSeconds is not positive — throws
Complexity: time O(n),
space O(n).
Worked example#
executed Captured by running this function on the input its own test provides. Real output of real code — but not asserted against a published figure.
Input#
[
  {
    "timestamp": "2026-01-05T09:30:00-05:00",
    "session_id": "XNYS-2026-01-05",
    "uptick_issues": 560,
    "downtick_issues": 440,
    "neutral_issues": 20,
    "ready": true
  },
  {
    "timestamp": "2026-01-05T09:31:00-05:00",
    "session_id": "XNYS-2026-01-05",
    "uptick_issues": 470,
    "downtick_issues": 530,
    "neutral_issues": 20,
    "ready": true
  },
  {
    "timestamp": "2026-01-05T09:32:00-05:00",
    "session_id": "XNYS-2026-01-05",
    "uptick_issues": 540,
    "downtick_issues": 460,
    "neutral_issues": 20,
    "ready": true
  }
]
Showing 3 of 36 elements.
060Call#
calculate(rows, seed, intervalSeconds)Returns#
object with 4 fields: status, value, interval_seconds, series
{
  "status": "resolved",
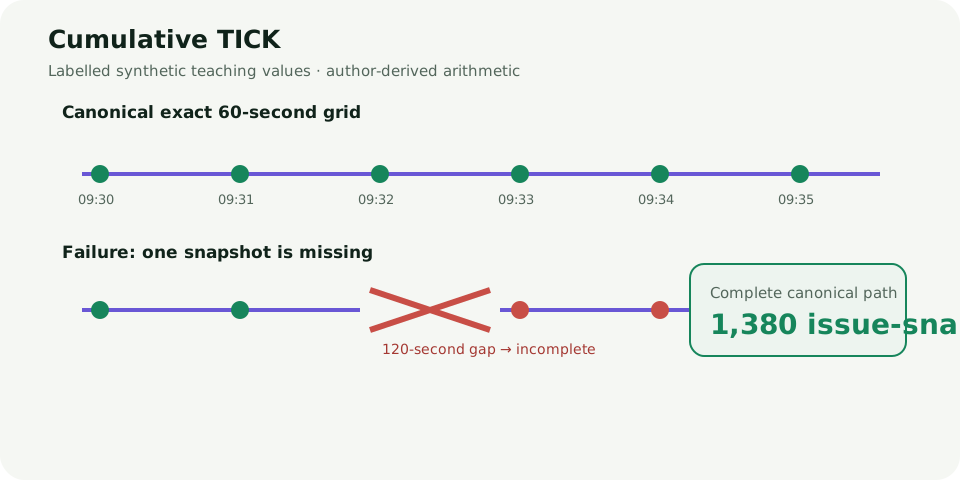
  "value": 1380,
  "interval_seconds": 60,
  "series": [
    {
      "timestamp": "2026-01-05T09:30:00-05:00",
      "tick": 120,
      "value": 120
    },
    {
      "timestamp": "2026-01-05T09:31:00-05:00",
      "tick": -60,
      "value": 60
    },
    {
      "timestamp": "2026-01-05T09:32:00-05:00",
      "tick": 80,
      "value": 140
    }
  ]
}Diagrams#
Calculation flow#
Calculation Flow — Cumulative TICK
flowchart LR
    A["One session and exact grid"] --> B{"Next timestamp gap = interval?"}
    B -->|"No"| X["Incomplete sampling_gap"]
    B -->|"Yes"| C["TICK = uptick − downtick issues"]
    C --> D["Cumulative = prior + TICK"]
    D --> E["Retain timestamp and trace"]
    E --> B
How it works#
This page states the contract — how to call it correctly. The article explains the concept: why it works, and where it breaks.
References#
- Claim-to-source map
- Glossary: TICK — StockCharts ChartSchool
- NYSE Real-Time Data — New York Stock Exchange
- NYSE Proprietary Data Products Technical Documents — New York Stock Exchange
- Historical-example decision