Normalized ATR and ATR Percentage
Install and import#
npm install fintech-algorithmsimport { normalizedAtrAndAtrPercentage } from "fintech-algorithms/technical-indicators/range-and-volatility-indicators/normalized-atr-and-atr-percentage";Signature#
normalizedAtrAndAtrPercentage(input)Wilder's Average True Range over period bars, and the same figure restated as a percentage of that bar's close.
Parameters#
| Name | Type | Notes |
|---|---|---|
input | TopicInput | bars is the required OHLCV array -- each bar carries timestamp, open, high, low, close, volume and an optional basis, strictly ordered by timestamp. From parameters this topic reads only period (default 14, integer >= 2), which is the Wilder RMA length used for the ATR. |
Returns#
TopicResult
series holds atr, the Wilder RMA of true range, and natr, 100 * atr / close. latest carries the last value of each. Both share the same warm-up: period - 1 leading nulls, so ready_at is 13 at the default period, the index where the RMA seed completes.
Warm-up#
The first `period - 1` bars (13 at the default period) positions are null. The ATR is seeded by averaging the first period true ranges, so nothing is emitted until that many bars exist. natr is derived from atr and inherits the same prefix; it is also null on any bar whose close is zero.
Errors#
- When
parameters.periodis not an integer >= 2 — throws Error - When a bar is missing open, high, low, close, or volume, or one of them is not a finite number — throws Error
- When bars are not strictly ordered by timestamp, or a bar's high is below its open, low, or close — throws Error
Complexity: time O(n),
space O(n).
Worked example#
executed Captured by running this function on the input its own test provides. Real output of real code — but not asserted against a published figure.
Input#
{
  "bars": [
    {
      "timestamp": "2024-01-02",
      "basis": "synthetic-unadjusted",
      "open": 100,
      "high": 101.45,
      "low": 98.695,
      "close": 100,
      "volume": 750000,
      "benchmark": 200
    },
    {
      "timestamp": "2024-01-03",
      "basis": "synthetic-unadjusted",
      "open": 101.49111452,
      "high": 103.38381693,
      "low": 100.05480022,
      "close": 101.78791214,
      "volume": 795117,
      "benchmark": 200.56326135
    },
    {
      "timestamp": "2024-01-04",
      "basis": "synthetic-unadjusted",
      "open": 102.45519048,
      "high": 104.6701838,
      "low": 100.91147007,
      "close": 102.9549389,
      "volume": 840234,
      "benchmark": 201.11020913
    }
  ],
  "parameters": {}
}Call#
normalizedAtrAndAtrPercentage(input)Returns#
object with 9 fields: topic_id, title, state, ready, ready_at, series, latest, parameters, …
{
  "topic_id": "D07-F06-A01",
  "title": "Normalized ATR and ATR Percentage",
  "state": "calculated",
  "ready": true,
  "ready_at": 13,
  "series": {
    "atr": [null, null, null, null, null, null],
    "natr": [null, null, null, null, null, null]
  },
  "latest": {
    "atr": 3.245219101666433,
    "natr": 3.2455172196242965
  },
  "parameters": {},
  "diagnostics": {
    "causal": true,
    "input_count": 96
  }
}Diagrams#
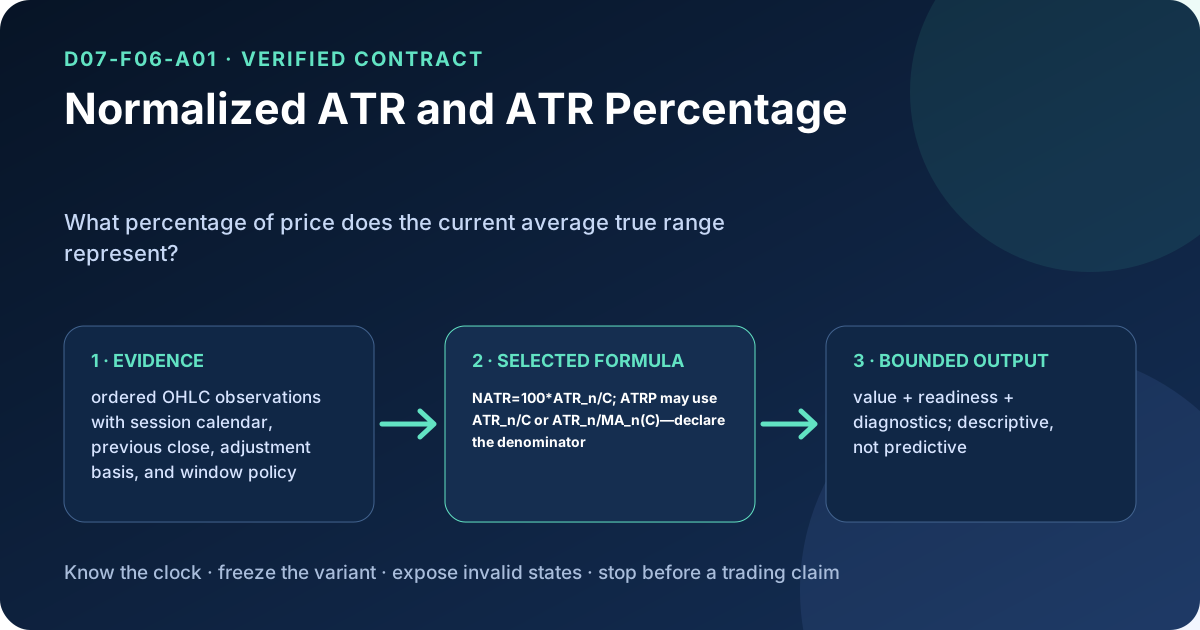
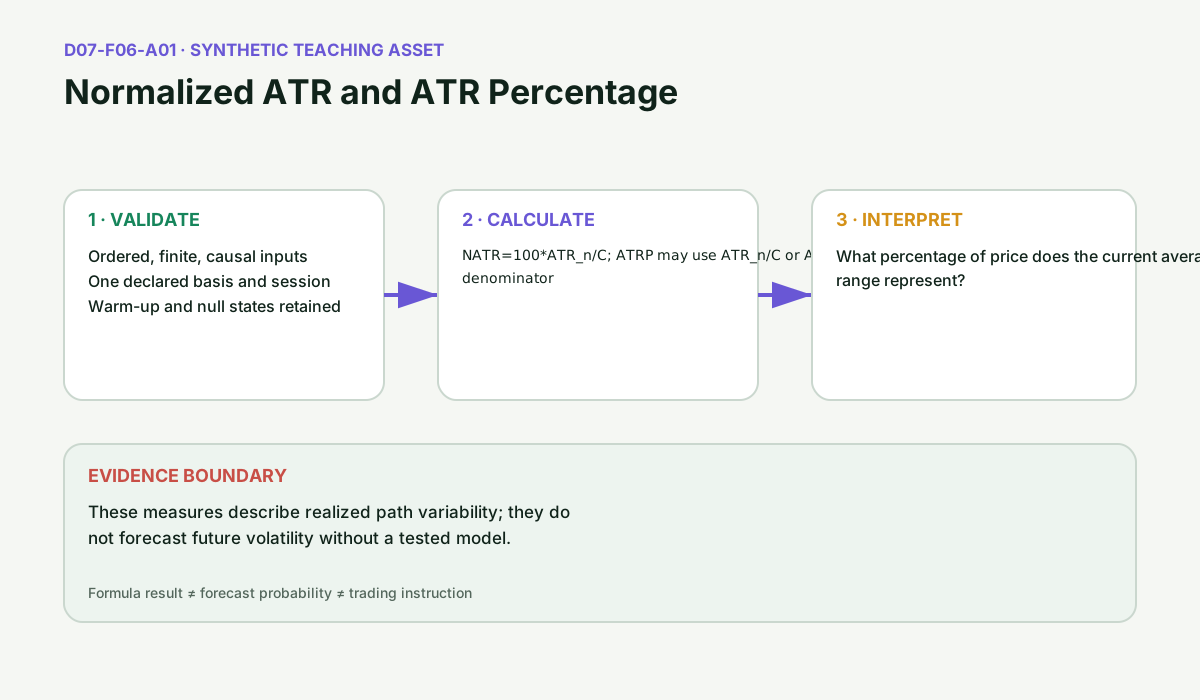
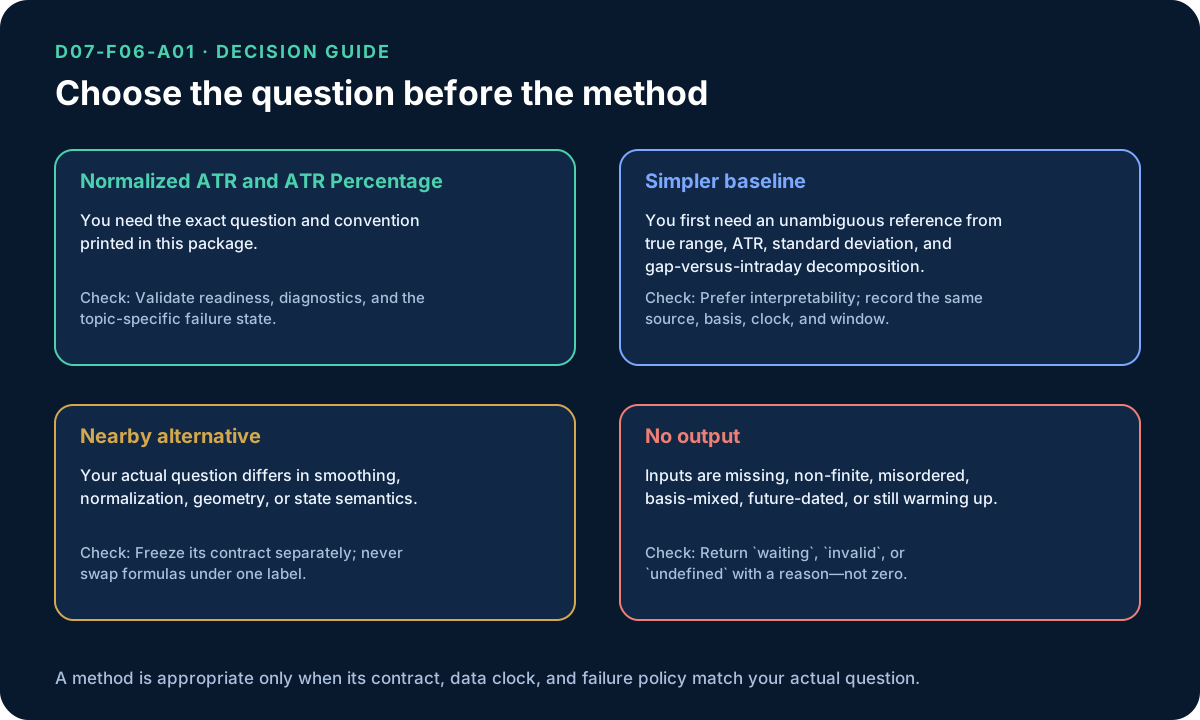
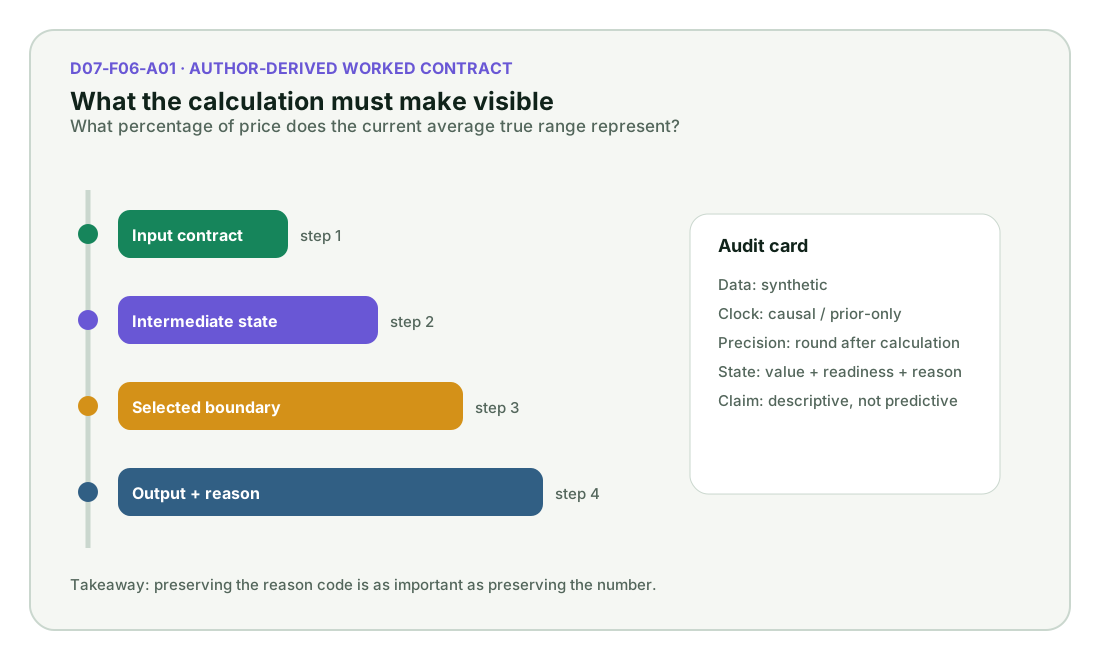
Calculation flow#
Normalized ATR and ATR Percentage calculation flow
flowchart LR
    A["ordered OHLC observations with session calendar, previous "] --> B["Validate order, basis, and finite values"]
    B --> C["Apply the selected Normalized ATR and ATR Percentage convention"]
    C --> D["Emit value, readiness, and diagnostics"]
    D --> E["Interpret descriptively; test outcomes separately"]
    B -->|invalid or insufficient| X["Withhold output with a reason"]
Normalized ATR and ATR Percentage readiness and evidence states
stateDiagram-v2
    [*] --> Waiting
    Waiting --> Ready: enough valid causal observations
    Waiting --> Rejected: malformed or unsupported input
    Ready --> Calculated: selected formula applied
    Calculated --> Interpreted: diagnostic and limitation retained
    Interpreted --> Ready: next observation arrives
    Rejected --> Waiting: corrected input and deterministic reset
How it works#
This page states the contract — how to call it correctly. The article explains the concept: why it works, and where it breaks.
References#
- TA-Lib function groups — TA-Lib project contributors
- TA-Lib C/C++ API — TA-Lib project contributors
- TA-Lib maintained source — TA-Lib project contributors
- Evidence decision
- Level 1 evidence map