Fast Fourier Transform Periodogram
Install and import#
npm install fintech-algorithmsimport { fftPeriodogram } from "fintech-algorithms/statistical-time-series/decomposition-and-cycles/fast-fourier-transform-periodogram";Signature#
fftPeriodogram(values, sampleFrequency, detrend, window)Estimates spectral power by frequency. Peaks suggest periodicity — but a trend leaks power across every frequency, which is why detrending is a parameter here rather than an afterthought.
Parameters#
| Name | Type | Notes |
|---|---|---|
values | number[] | Observation series. |
sampleFrequency | number | Observations per unit time, which sets the units of the returned frequencies. min: 0 |
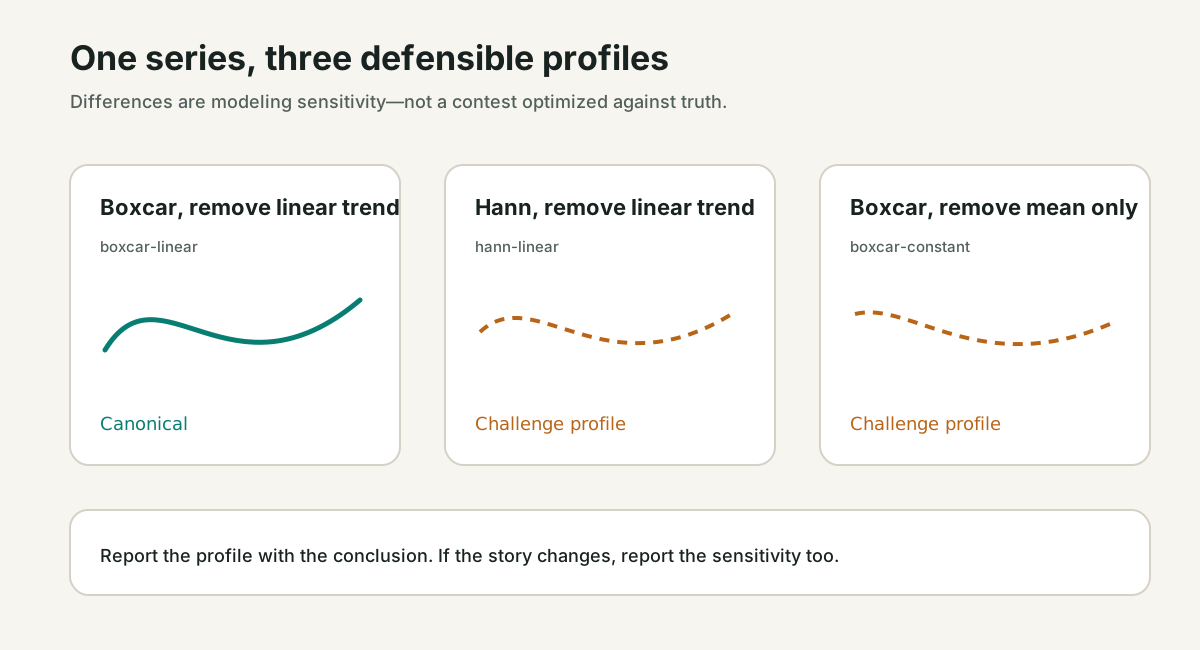
detrend | boolean | Remove a linear trend before transforming. Leaving a trend in produces a spurious peak at the lowest frequency. |
window | string | Taper applied before the transform, reducing spectral leakage at the cost of resolution. |
Returns#
{ frequencies, power, dominant_frequency, … }
Power per frequency with the dominant one identified.
Errors#
- When sampleFrequency is not positive, or the window is unrecognised — throws
Complexity: time O(n log n),
space O(n).
Worked example#
executed Captured by running this function on the input its own test provides. Real output of real code — but not asserted against a published figure.
Input#
[
  100.0901805654,
  101.3367333472,
  102.4083163971,
  102.9128416721,
  103.198587938,
  102.4311805579
]
Showing 6 of 192 elements.
1"linear""boxcar"Call#
fftPeriodogram(values, sampleFrequency, detrend, window)Returns#
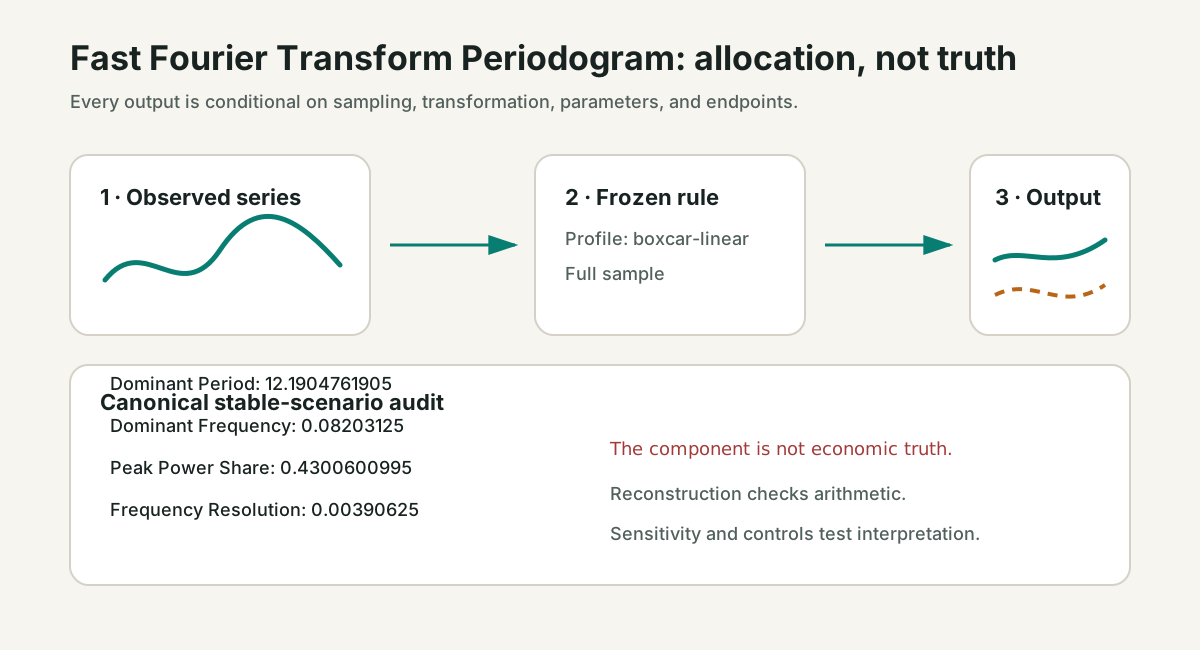
object with 12 fields: frequency, power_density, nfft, sample_frequency, window, detrend, removed_mean, removed_slope_per_observation, …
{
  "frequency": [0, 0.00390625, 0.0078125, 0.01171875, 0.015625, 0.01953125],
  "power_density": [
    1.0488462970643929e-25,
    1.6358893918182345,
    4.265767680939771,
    5.308886555246375,
    0.7314454315603167,
    3.8642684877953584
  ],
  "nfft": 256,
  "sample_frequency": 1,
  "window": "boxcar",
  "detrend": "linear",
  "removed_mean": 103.83348592556456,
  "removed_slope_per_observation": 0.03635627769934048,
  "dominant_index": 21,
  "dominant_frequency": 0.08203125,
  "dominant_period": 12.19047619047619,
  "peak_power_share": 0.4300600995492311
}
Other exports#
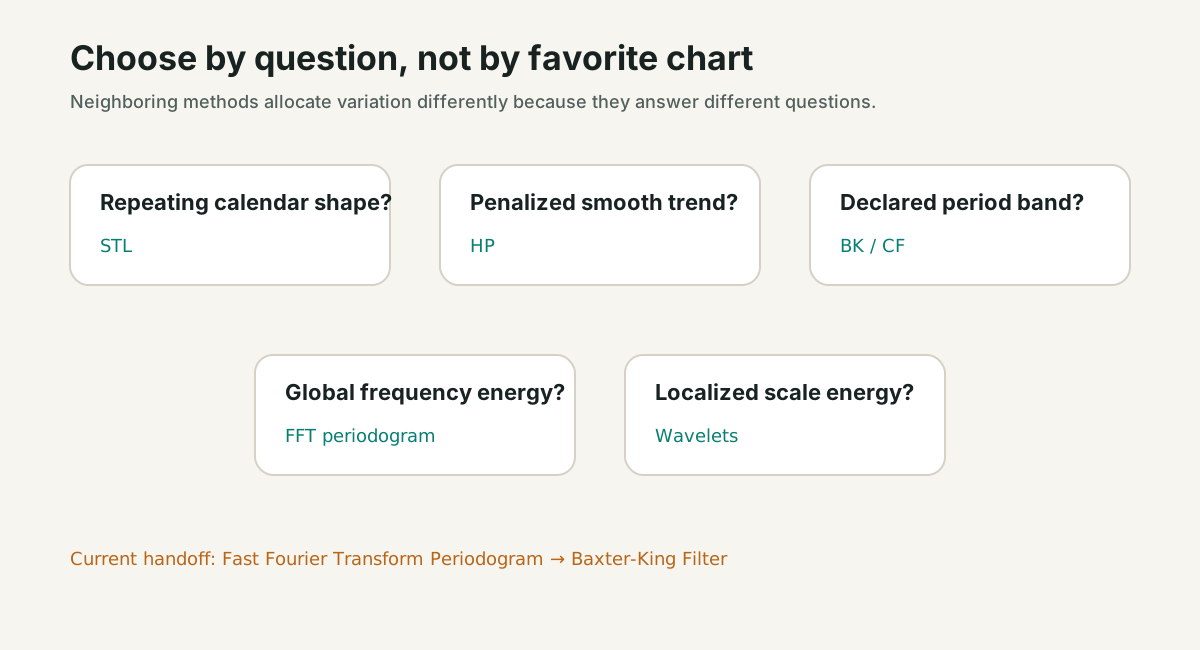
This module also exports
stlDecompose, hpFilter, bkFilter, cfFilter, haarWavelet, runTopic. Every module additionally exports run as an alias of its
primary function, and a meta object carrying its catalog id, domain, family,
shape and article URL.
Diagrams#
Calculation flow#
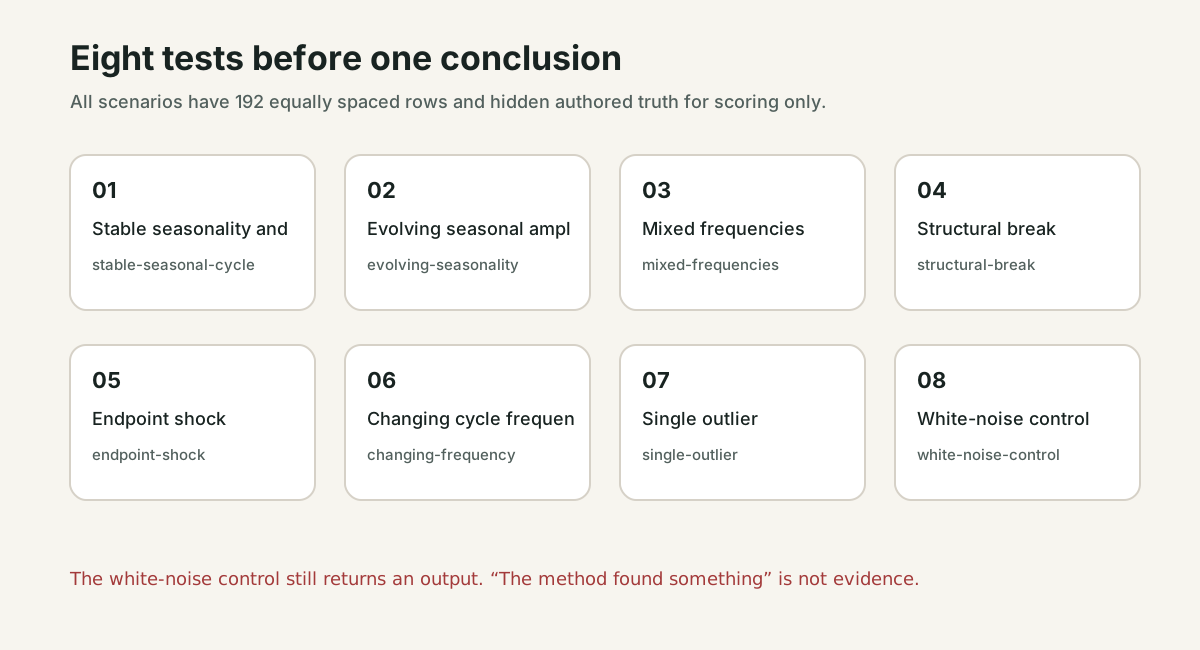
Fast Fourier Transform Periodogram — Audit Flow
flowchart LR
    A["Finite evenly sampled values"] --> B["Freeze transformation and profile"]
    B --> C["Detrend → window → FFT → power"]
    C --> D["Component or power output"]
    D --> E["Reconstruction / accounting check"]
    E --> F["Endpoint and revision audit"]
    F --> G["Profile sensitivity"]
    G --> H["White-noise control"]
    H --> I{"Decision use justified?"}
    I -->|No| J["Keep as descriptive diagnostic"]
    I -->|Yes| K["Rebuild causally and test out of sample"]
How it works#
This page states the contract — how to call it correctly. The article explains the concept: why it works, and where it breaks.
References#
- Evidence table
- Source records
- Evidence policy
- Version notes