Tick-Run Bars
Install and import#
npm install fintech-algorithmsimport { constructBars } from "fintech-algorithms/market-data-engineering/bar-construction/tick-run-bars";Signature#
constructBars(trades, config)Closes a bar when a run of same-signed trades exceeds what the recent buy probability makes plausible. Where imbalance bars react to net one-sidedness, run bars react to *persistence*.
Parameters#
| Name | Type | Notes |
|---|---|---|
trades | Trade[] | The raw tape in chronological order. Each trade carries tradeId, timestamp, session, symbol, price, volume and currency. |
config | { initialTickSign: number; initialExpectedTicks: number; initialBuyProbability: number; alphaTicks: number; alphaBuyProbability: number; thresholdFloorTicks: number; thresholdMultiplier: number; closePartial?: boolean } | initialBuyProbability seeds the estimate of how often trades arrive buyer-initiated, updated by alphaBuyProbability. The threshold is bounded below by thresholdFloorTicks. |
Returns#
Bar[] · length fewer
One bar per run event.
Errors#
- When any alpha or probability falls outside 0…1 — throws
Complexity: time O(n),
space O(bars).
Worked example#
verified This is the worked example published in the article, replayed by the test suite on every run. The output cannot drift.
Input#
[
  {
    "tradeId": "W01",
    "timestamp": "2026-01-05T14:30:00.000Z",
    "session": "S1",
    "symbol": "SYNTH",
    "price": 100,
    "volume": 10,
    "currency": "USD"
  },
  {
    "tradeId": "W02",
    "timestamp": "2026-01-05T14:30:01.000Z",
    "session": "S1",
    "symbol": "SYNTH",
    "price": 100,
    "volume": 20,
    "currency": "USD"
  },
  {
    "tradeId": "W03",
    "timestamp": "2026-01-05T14:30:02.000Z",
    "session": "S1",
    "symbol": "SYNTH",
    "price": 99.9,
    "volume": 15,
    "currency": "USD"
  }
]
Showing 3 of 8 elements.
{
  "closePartial": true,
  "initialTickSign": 1,
  "initialExpectedTicks": 4,
  "initialBuyProbability": 0.625,
  "alphaTicks": 0.5,
  "alphaBuyProbability": 0.5,
  "thresholdFloorTicks": 2,
  "thresholdMultiplier": 1
}Call#
constructBars(trades, config)Returns#
array of 2 objects
[
  {
    "firstTradeId": "W01",
    "lastTradeId": "W04",
    "tickCount": 4,
    "buyTicks": 3,
    "sellTicks": 1,
    "dominantSide": "buy",
    "thresholdTicks": 2.5,
    "overshootTicks": 0.5,
    "closeReason": "threshold"
  },
  {
    "firstTradeId": "W05",
    "lastTradeId": "W08",
    "tickCount": 4,
    "buyTicks": 1,
    "sellTicks": 3,
    "dominantSide": "sell",
    "thresholdTicks": 2.75,
    "overshootTicks": 0.25,
    "closeReason": "threshold"
  }
]Diagrams#
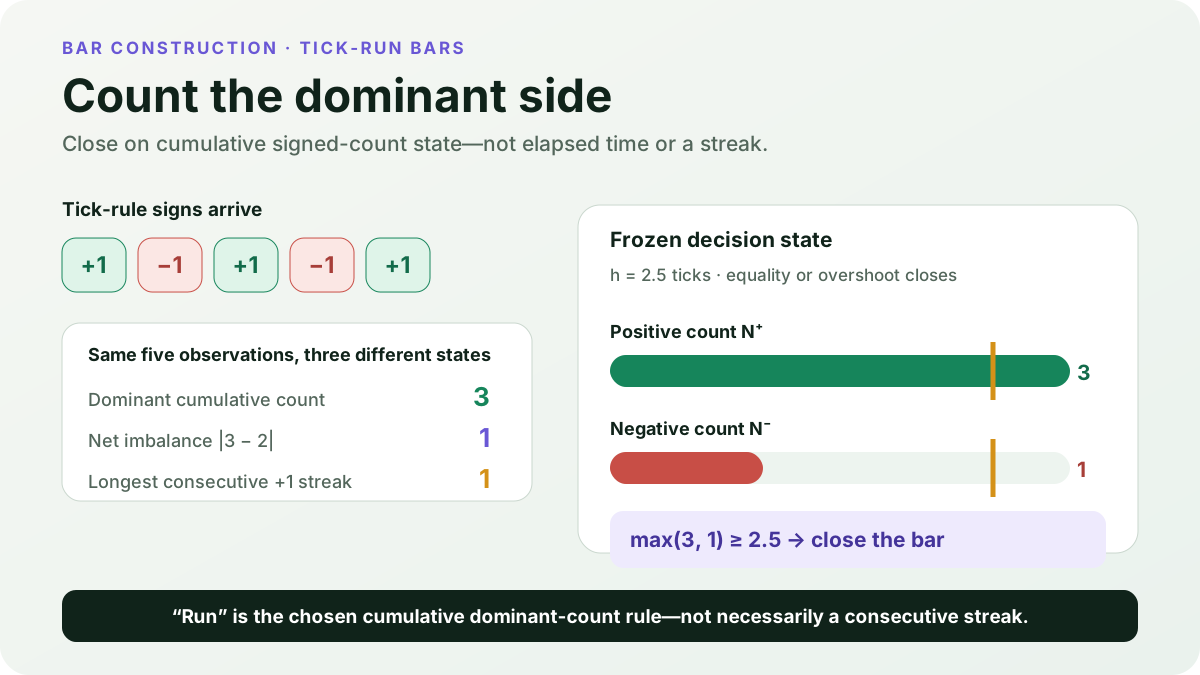
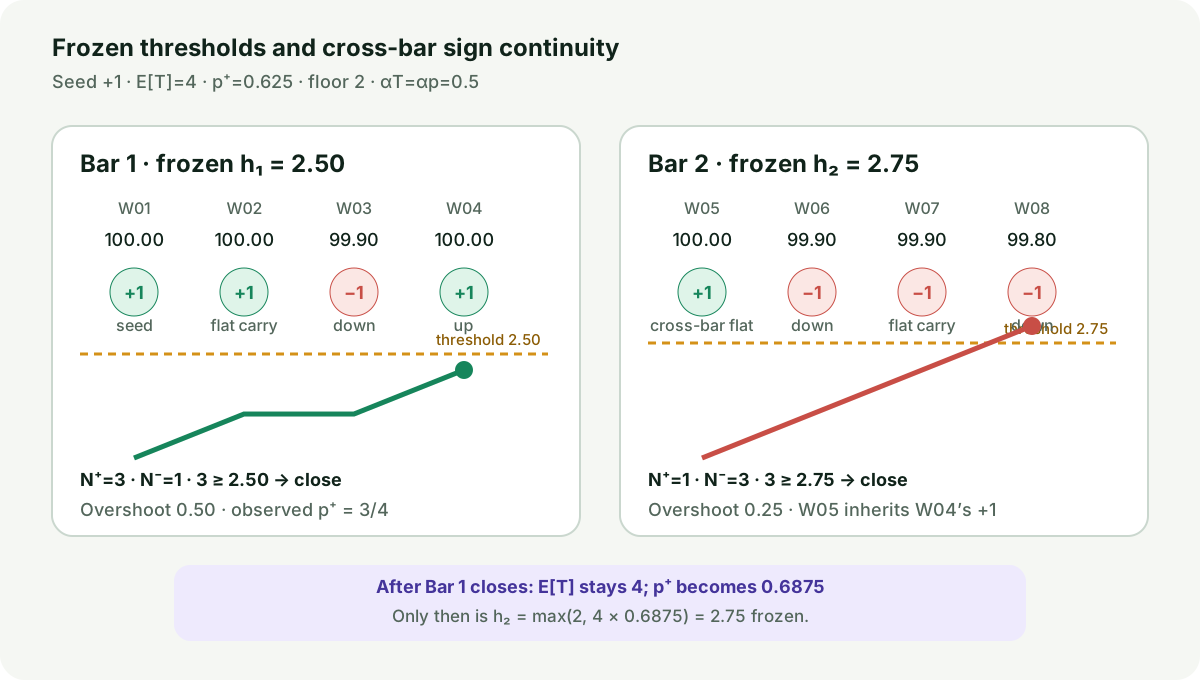
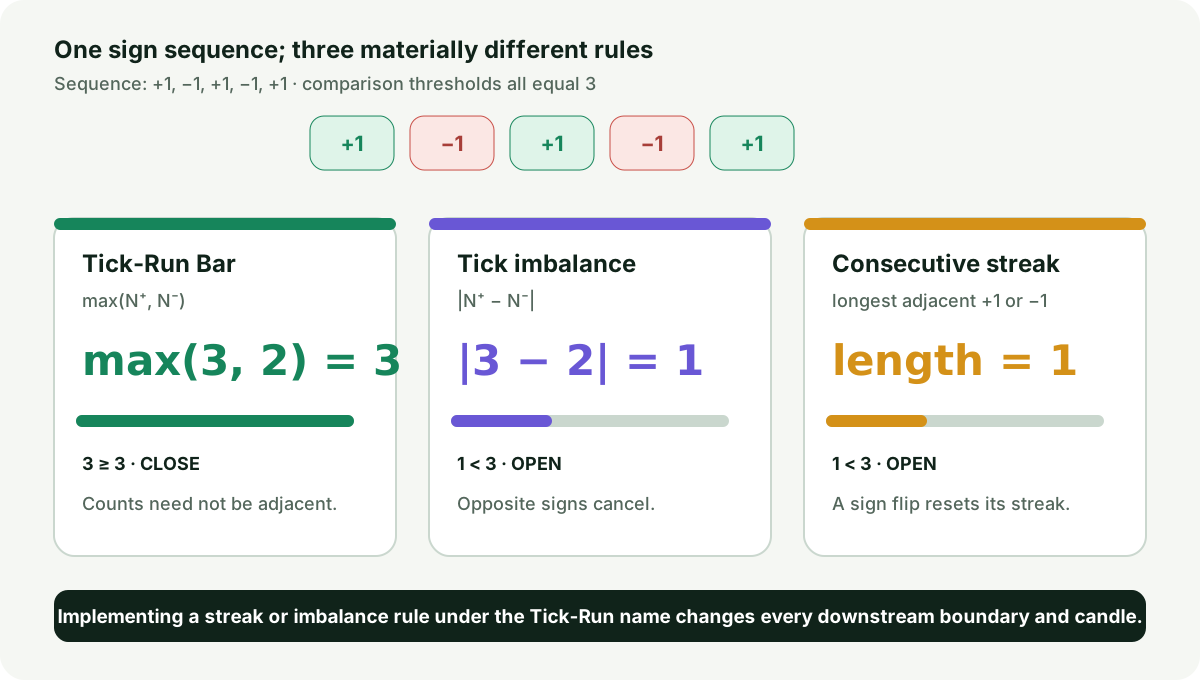
Calculation flow#
Causal construction flow — Tick-Run Bars
flowchart TD
    A["Receive cleaned chronological trade"] --> B{"New session?"}
    B -->|Yes| C["Emit or drop partial; reset price, sign, expectations, and bar state"]
    B -->|No| D["Keep session state"]
    C --> E["Assign tick sign; flat carries prior sign"]
    D --> E
    E --> F["Update OHLCV, N+, and N−"]
    F --> G{"max(N+, N−) >= frozen h?"}
    G -->|No| A
    G -->|Yes| H["Emit complete bar with lineage and diagnostics"]
    H --> I["Update E[T] and p+ from the completed bar"]
    I --> J["Freeze the next threshold"]
    J --> A
How it works#
This page states the contract — how to call it correctly. The article explains the concept: why it works, and where it breaks.
References#
- *Advances in Financial Machine Learning*, Section 2.3.2.2 — Marcos López de Prado
- Inferring Trade Direction from Intraday Data — Charles M. C. Lee and Mark J. Ready
- NYSE Daily TAQ Client Specification — New York Stock Exchange / Intercontinental Exchange
- Trade Reporting Frequently Asked Questions — Financial Industry Regulatory Authority (FINRA)
- Evidence classification
- Data, licensing, and historical-example decision