Frequency Tables and Relative Frequency
Install and import#
npm install fintech-algorithmsimport { frequencyTablesAndRelativeFrequency } from "fintech-algorithms/foundations/location-ranking-and-exploratory-summaries/frequency-tables-and-relative-frequency";Signature#
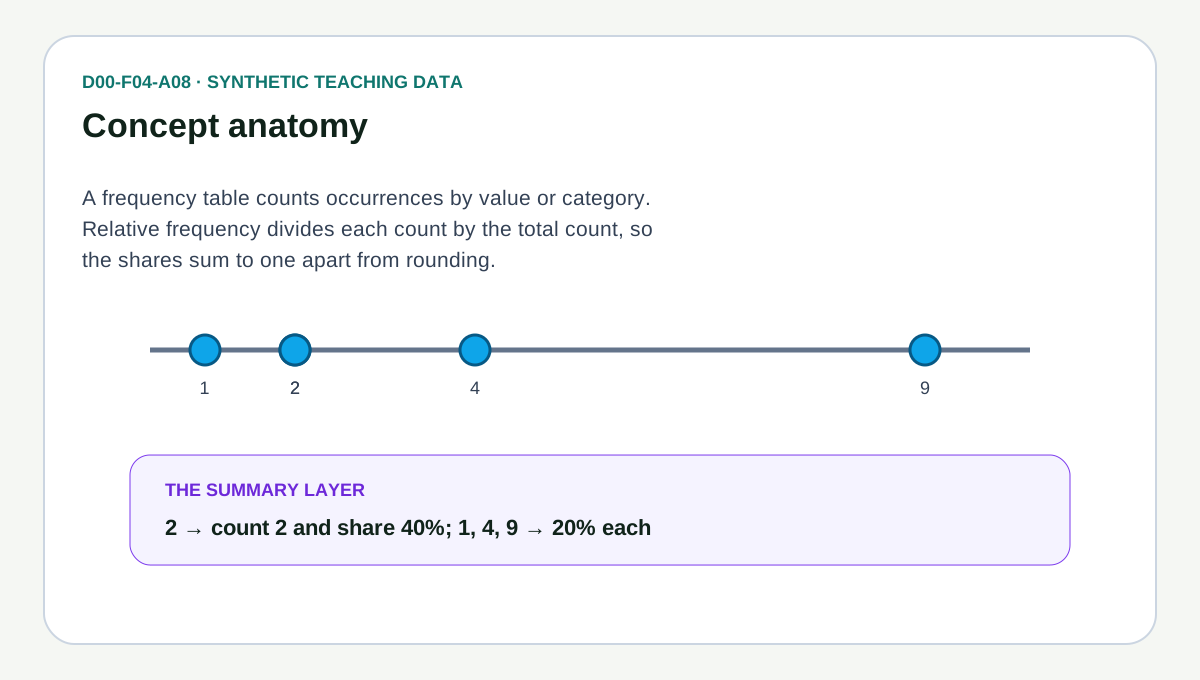
frequencyTablesAndRelativeFrequency(input)Counts how often each distinct value occurs in a numeric series and expresses those counts as shares of the total.
Parameters#
| Name | Type | Notes |
|---|---|---|
input | { values: number[] } | The observations to tabulate, under the key values. Distinctness is exact numeric equality after Number coercion, so this suits repeated discrete levels rather than continuous measurements. |
Returns#
{ frequency: Record<string, number>; relativeFrequency: Record<string, number> }
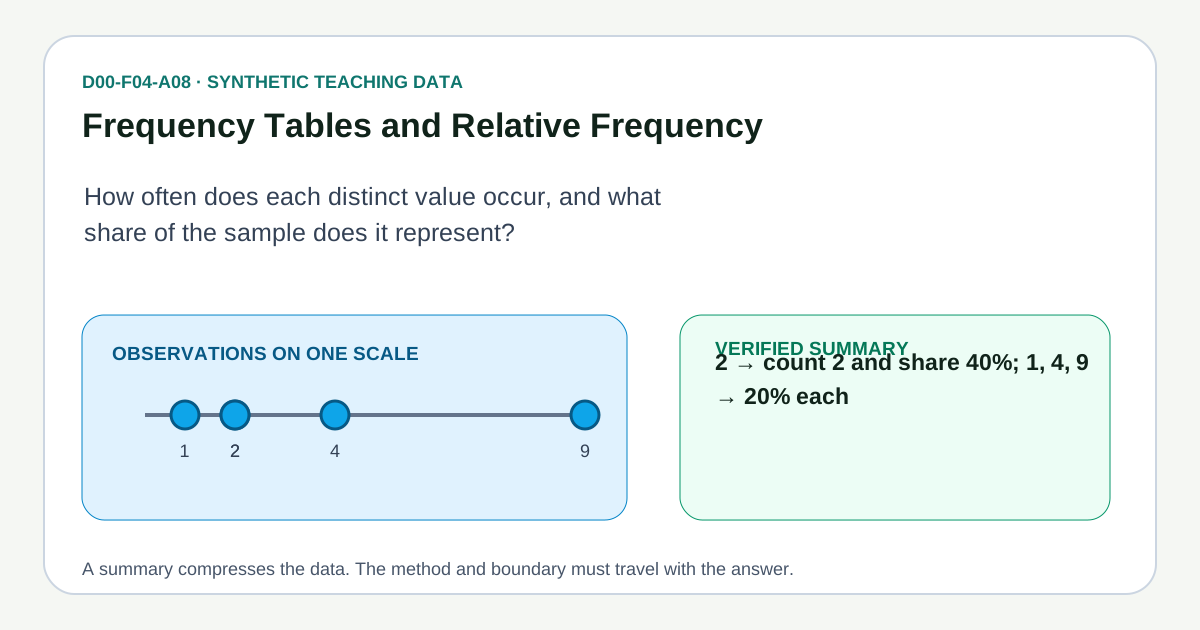
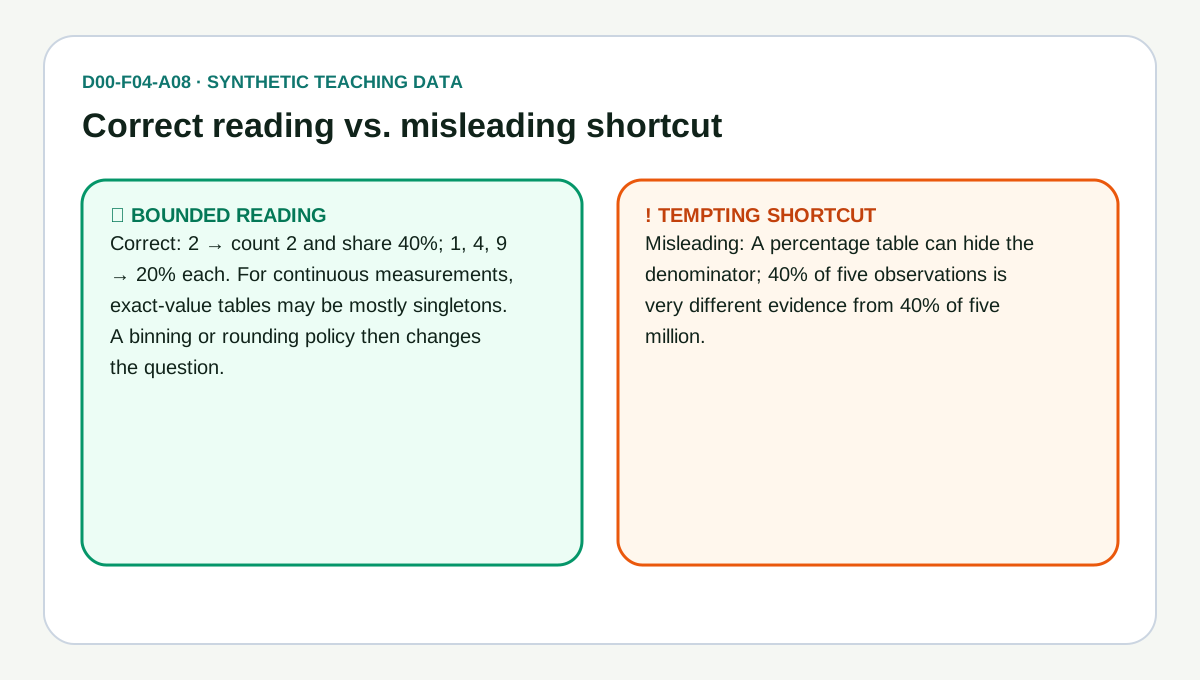
Both maps are keyed by the distinct values rendered as strings, in ascending numeric order. frequency holds raw counts and relativeFrequency holds each count divided by the number of observations.
Errors#
- When
inputis null, an array, or not an object — throws TypeError - When
valuesis missing, is not an array, or is empty — throws RangeError - When any entry of
valuesdoes not coerce to a finite number — throws RangeError
Complexity: time O(n log n),
space O(n).
Worked example#
verified This is the worked example published in the article, replayed by the test suite on every run. The output cannot drift.
Input#
{
  "values": [1, 2, 2, 4, 9],
  "weights": [1, 1, 2, 1, 1],
  "trimProportion": 0.2,
  "bins": 4
}Call#
frequencyTablesAndRelativeFrequency(input)Returns#
object with 2 fields: frequency, relativeFrequency
{
  "frequency": {
    "1": 1,
    "2": 2,
    "4": 1,
    "9": 1
  },
  "relativeFrequency": {
    "1": 0.2,
    "2": 0.4,
    "4": 0.2,
    "9": 0.2
  }
}Diagrams#
Calculation flow#
Reasoning flow — D00-F04-A08
flowchart LR
    A["Finite observations"] --> B["Name units and scope"]
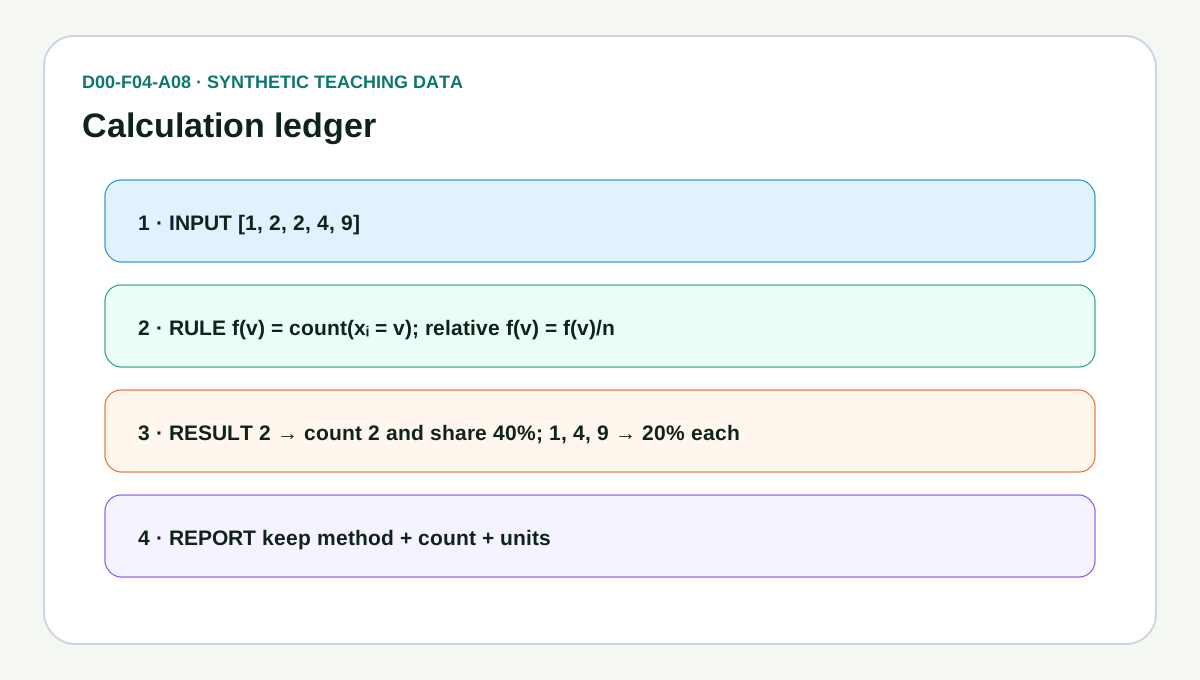
    B --> C["Freeze: f(v) = count(xᵢ = v); relative f(v) = f(v)/n"]
    C --> D["Calculate full precision"]
    D --> E{"Boundary satisfied?"}
    E -->|Yes| F["Report 2 → count 2 and share 40%; 1, 4, 9 → 20% each"]
    E -->|No| G["Abstain and repair contract"]
    F --> H["Pair with distribution context"]
How it works#
This page states the contract — how to call it correctly. The article explains the concept: why it works, and where it breaks.
References#
- Histogram
- Historical-example decision