Median Absolute Deviation Outlier Filter
Install and import#
npm install fintech-algorithmsimport { madOutliers } from "fintech-algorithms/market-data-engineering/cleaning-and-validation/median-absolute-deviation-outlier-filter";Signature#
madOutliers(values, threshold, scale, minimumSamples)Whole-sample outlier detection against the median absolute deviation. Where the Hampel filter is local and rolling, this judges every point against one global robust spread.
Parameters#
| Name | Type | Notes |
|---|---|---|
values | number[] | The complete sample to evaluate. |
threshold | number | How many scaled MADs from the median a point may sit before it is flagged. min: 0 |
scale | number | MAD-to-sigma conversion factor; 1.4826 makes the result comparable to a standard deviation under normality. min: 0 |
minimumSamples | number | Below this count the function reports insufficient data rather than guessing from a handful of points. min: 1 · integer: true |
Returns#
{ status, valid_count, median, raw_mad, scaled_mad, threshold, outliers }
The decision plus every statistic behind it, so a surprising result can be checked rather than re-derived.
Errors#
- When threshold or scale is negative — throws
Complexity: time O(n log n),
space O(n).
Worked example#
executed Captured by running this function on the input its own test provides. Real output of real code — but not asserted against a published figure.
Input#
[10, 10.1, 9.9, 10.2, 10.1, 9.8]Showing 6 of 13 elements.
3.51.48257968865826543Call#
madOutliers(values, threshold, scale, minimumSamples)Returns#
object with 9 fields: status, valid_count, minimum_samples, median, raw_mad, scaled_mad, scale, threshold, …
{
  "status": "ok",
  "valid_count": 12,
  "minimum_samples": 3,
  "median": 10.05,
  "raw_mad": 0.09999999999999964,
  "scaled_mad": 0.148257968865826,
  "scale": 1.4825796886582654,
  "threshold": 3.5,
  "points": [
    {
      "index": 0,
      "value": 10,
      "score": 0.337250000000006,
      "outlier": false
    },
    {
      "index": 1,
      "value": 10.1,
      "score": 0.337249999999994,
      "outlier": false
    },
    {
      "index": 2,
      "value": 9.9,
      "score": 1.011750000000006,
      "outlier": false
    }
  ]
}Diagrams#
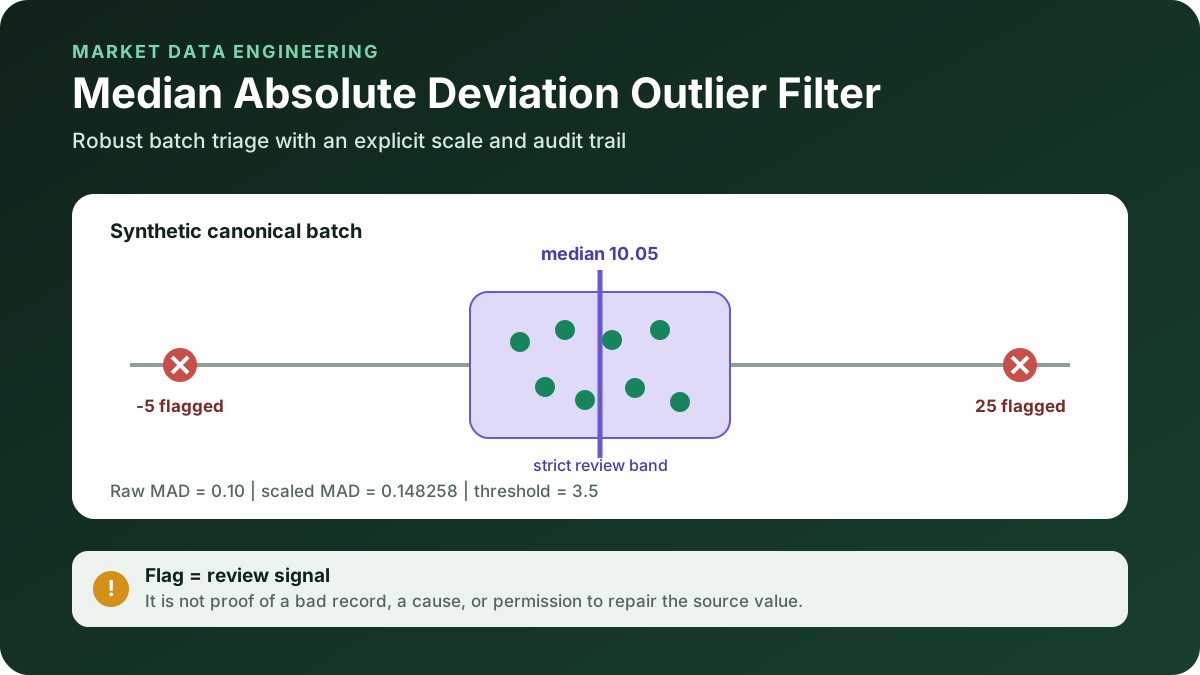
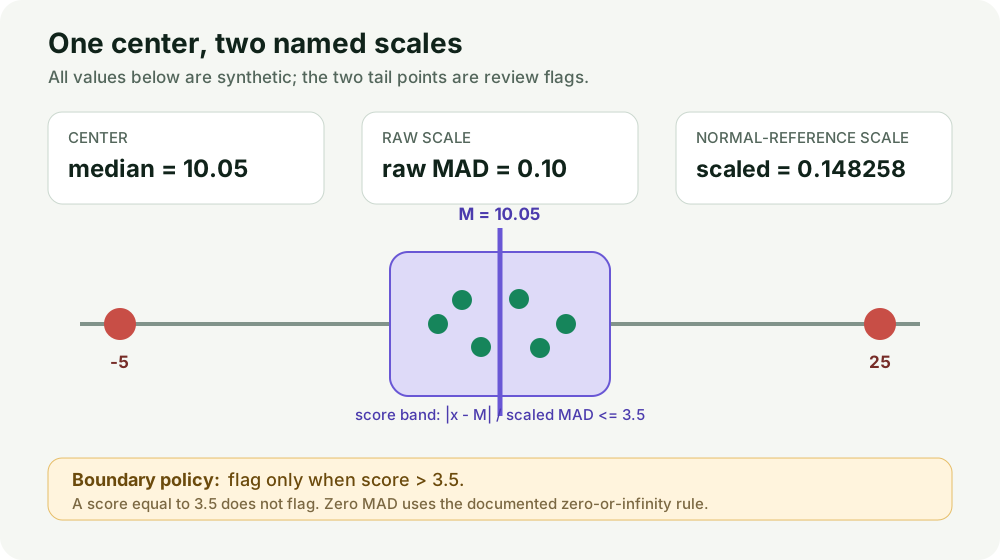
Calculation flow#
Global MAD classification flow
flowchart TD
    A["Comparable source records"] --> B["Partition by unit, field, time basis, and adjustment basis"]
    B --> C["Reject nonfinite values; preserve missing positions"]
    C --> D{"Enough finite observations?"}
    D -->|No| E["Insufficient sample; no scores or flags"]
    D -->|Yes| F["Compute median, raw MAD, and scaled MAD"]
    F --> G{"Raw MAD equals zero?"}
    G -->|No| H["Score absolute distance divided by scaled MAD"]
    G -->|Yes| I["Equal values score 0; unequal values score infinity"]
    H --> J["Flag only score strictly above threshold"]
    I --> J
    J --> K["Emit diagnostics and preserve raw input"]
How it works#
This page states the contract — how to call it correctly. The article explains the concept: why it works, and where it breaks.
References#
- NIST-SCALE - Measures of Scale — NIST/SEMATECH
- NIST-DATAPLOT - Median Absolute Deviation — National Institute of Standards and Technology
- HAMPEL-1974 - The Influence Curve and Its Role in Robust Estimation — Frank R. Hampel
- Package-policy classification