Efficiency Ratio
Install and import#
npm install fintech-algorithmsimport { efficiencyRatio } from "fintech-algorithms/geometric-chart-patterns/market-structure-breakouts-and-regimes/efficiency-ratio";Signature#
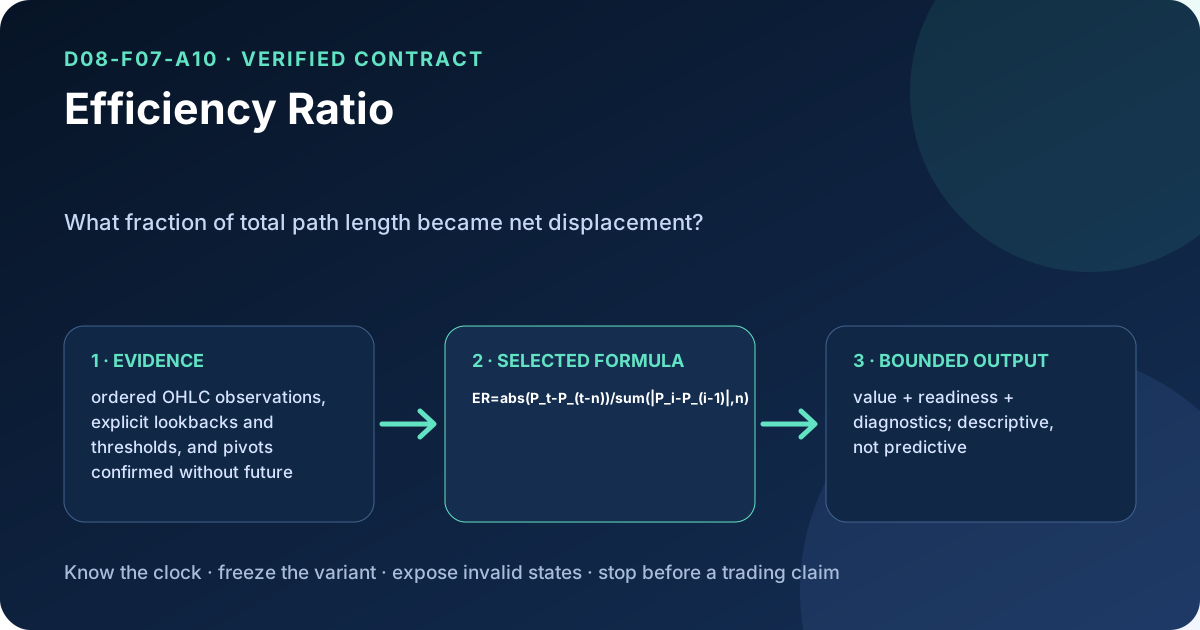
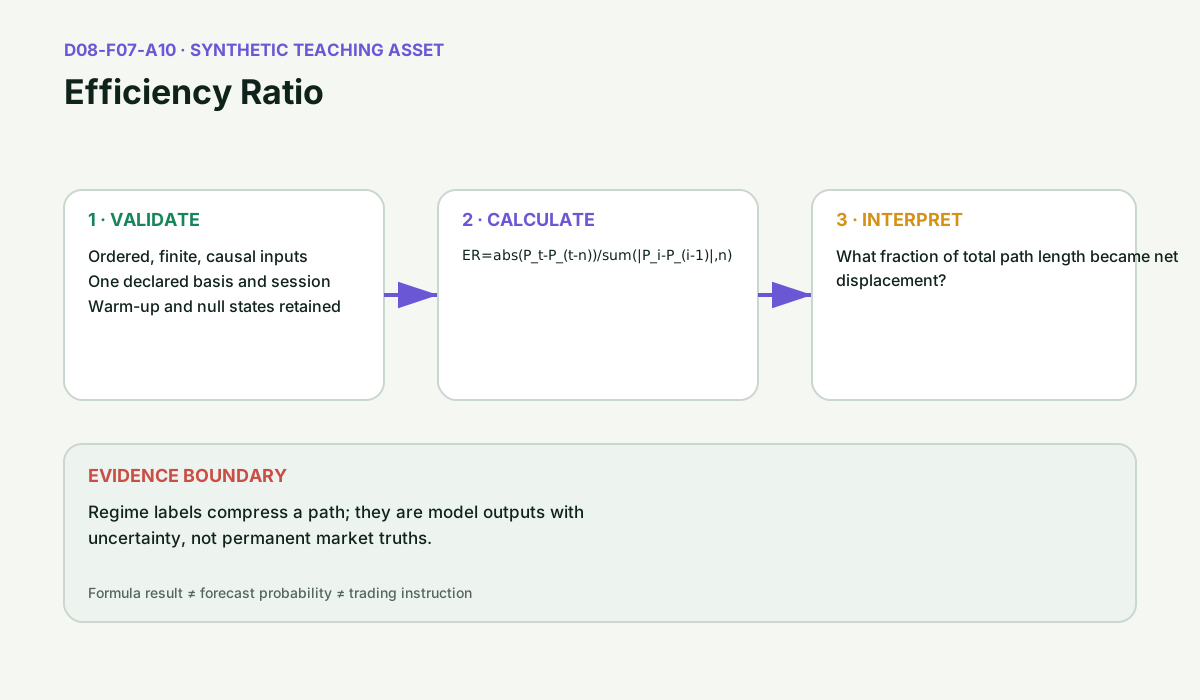
efficiencyRatio(input)Kaufman's ratio of net displacement to gross travel: the absolute change in close over period bars divided by the sum of the absolute bar-to-bar changes across the same span. Near 1 the market went somewhere; near 0 it churned.
Parameters#
| Name | Type | Notes |
|---|---|---|
input | TopicInput | bars is the required OHLCV history, strictly ordered by timestamp and on a single adjustment basis. parameters.period (default 20, integer of at least 2) sets the lookback. |
Returns#
TopicResult
series and latest carry a single value key, unscaled and between 0 and 1. The warm-up is period bars, so with the default ready_at is 20; value is also null on any window whose absolute changes sum to zero.
Warm-up#
The first period bars (20 by default) positions are null. The numerator needs a close period bars back and the denominator's rolling sum rejects the null at index 0, so both align on index period.
Errors#
- When
periodis supplied as a non-integer or as a value below 2 — throws Error - When a bar's
closeis not a finite number — throws Error
Complexity: time O(n × period),
space O(n).
Worked example#
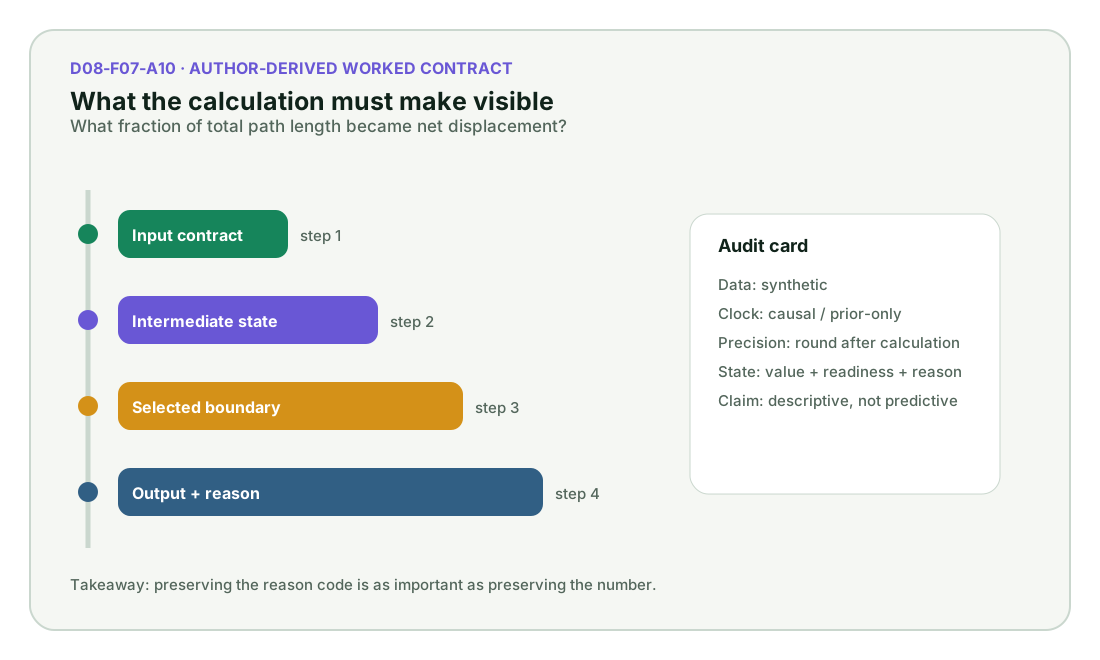
executed Captured by running this function on the input its own test provides. Real output of real code — but not asserted against a published figure.
Input#
{
  "bars": [
    {
      "timestamp": "2024-01-02",
      "basis": "synthetic-unadjusted",
      "open": 100,
      "high": 101.45,
      "low": 98.695,
      "close": 100,
      "volume": 750000,
      "benchmark": 200
    },
    {
      "timestamp": "2024-01-03",
      "basis": "synthetic-unadjusted",
      "open": 101.49111452,
      "high": 103.38381693,
      "low": 100.05480022,
      "close": 101.78791214,
      "volume": 795117,
      "benchmark": 200.56326135
    },
    {
      "timestamp": "2024-01-04",
      "basis": "synthetic-unadjusted",
      "open": 102.45519048,
      "high": 104.6701838,
      "low": 100.91147007,
      "close": 102.9549389,
      "volume": 840234,
      "benchmark": 201.11020913
    }
  ],
  "parameters": {}
}Call#
efficiencyRatio(input)Returns#
object with 9 fields: topic_id, title, state, ready, ready_at, series, latest, parameters, …
{
  "topic_id": "D08-F07-A10",
  "title": "Efficiency Ratio",
  "state": "calculated",
  "ready": true,
  "ready_at": 20,
  "series": {
    "value": [null, null, null, null, null, null]
  },
  "latest": {
    "value": 0.08092573520497529
  },
  "parameters": {},
  "diagnostics": {
    "causal": true,
    "input_count": 96
  }
}Diagrams#
Calculation flow#
Efficiency Ratio calculation flow
flowchart LR
    A["ordered OHLC observations, explicit lookbacks and threshol"] --> B["Validate order, basis, and finite values"]
    B --> C["Apply the selected Efficiency Ratio convention"]
    C --> D["Emit value, readiness, and diagnostics"]
    D --> E["Interpret descriptively; test outcomes separately"]
    B -->|invalid or insufficient| X["Withhold output with a reason"]
Efficiency Ratio readiness and evidence states
stateDiagram-v2
    [*] --> Waiting
    Waiting --> Ready: enough valid causal observations
    Waiting --> Rejected: malformed or unsupported input
    Ready --> Calculated: selected formula applied
    Calculated --> Interpreted: diagnostic and limitation retained
    Interpreted --> Ready: next observation arrives
    Rejected --> Waiting: corrected input and deterministic reset
How it works#
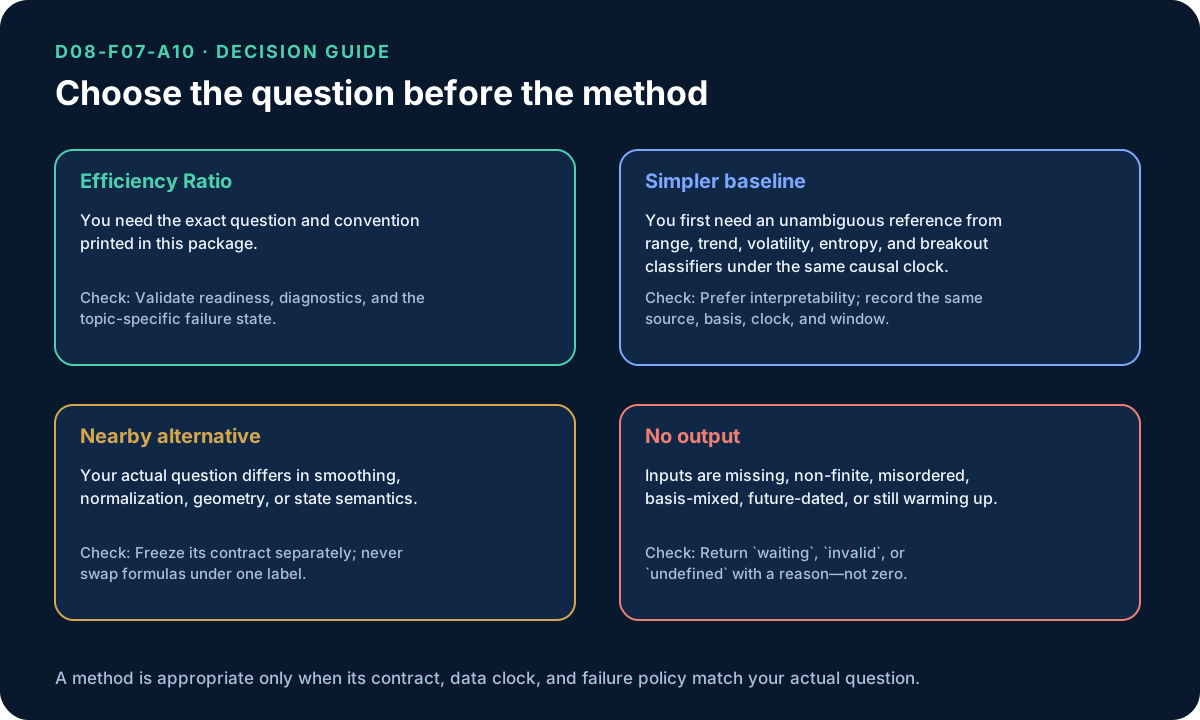
This page states the contract — how to call it correctly. The article explains the concept: why it works, and where it breaks.
References#
- Technical Analysis: Modern Perspectives (CFA Institute Research Foundation) — Gordon Scott, Michael Carr and Mark Cremonie; CFA Institute Research Foundation
- TA-Lib maintained source — TA-Lib project contributors
- Long-Term Storage Capacity of Reservoirs — H. E. Hurst
- Evidence decision
- Level 1 evidence map