Hampel Bad-Tick Filter
Install and import#
npm install fintech-algorithmsimport { hampelFilter } from "fintech-algorithms/market-data-engineering/cleaning-and-validation/hampel-bad-tick-filter";Signature#
hampelFilter(values, options)Flags points that sit too far from a rolling median, measured in robust deviations rather than standard deviations — so one fat-finger print cannot inflate the very statistic used to detect it.
Parameters#
| Name | Type | Notes |
|---|---|---|
values | number[] | Observation series in chronological order. |
options | { windowRadius?: number; threshold?: number; scale?: number; minHistory?: number; mode?: "causal" | "centred" } | windowRadius is the half-width of the rolling window (default 3). threshold is how many scaled MADs count as an outlier. scale converts MAD to a standard-deviation equivalent (1.4826 for normal data). minHistory is the minimum sample before any judgement is made. mode chooses causal — history only, safe for live use — or centred, which sees future points and must never be used on a live feed.optional |
Returns#
Verdict[] · length same-as-input
One verdict per point with its median, deviation and the threshold applied. Returns one verdict per input row rather than throwing, so a single bad record cannot abort the batch — and cannot pass unnoticed either.
Errors#
- When windowRadius or threshold is not positive — throws
Complexity: time O(n × windowRadius),
space O(n).
Worked example#
executed Captured by running this function on the input its own test provides. Real output of real code — but not asserted against a published figure.
Input#
[100, 100.1, 99.9, 100, 100.1, 112]Showing 6 of 17 elements.
{
  "windowRadius": 3,
  "threshold": 3,
  "scale": 1.4826,
  "minHistory": 3,
  "mode": "causal"
}Call#
hampelFilter(values, options)Returns#
array of 17 objects
[
  {
    "index": 0,
    "value": 100,
    "mode": "causal",
    "windowStart": 0,
    "windowEnd": 0,
    "windowCount": 1,
    "median": 100,
    "mad": 0,
    "scaledMad": 0,
    "score": null,
    "threshold": 3,
    "flagged": false,
    "status": "insufficient_history",
    "lookaheadUsed": false
  },
  {
    "index": 1,
    "value": 100.1,
    "mode": "causal",
    "windowStart": 0,
    "windowEnd": 1,
    "windowCount": 2,
    "median": 100.05,
    "mad": 0.04999999999999716,
    "scaledMad": 0.07412999999999578,
    "score": null,
    "threshold": 3,
    "flagged": false,
    "status": "insufficient_history",
    "lookaheadUsed": false
  },
  {
    "index": 2,
    "value": 99.9,
    "mode": "causal",
    "windowStart": 0,
    "windowEnd": 2,
    "windowCount": 3,
    "median": 100,
    "mad": 0.09999999999999432,
    "scaledMad": 0.14825999999999157,
    "score": 0.6744907594765952,
    "threshold": 3,
    "flagged": false,
    "status": "eligible",
    "lookaheadUsed": false
  }
]
Showing 3 of 17 elements.
Diagrams#
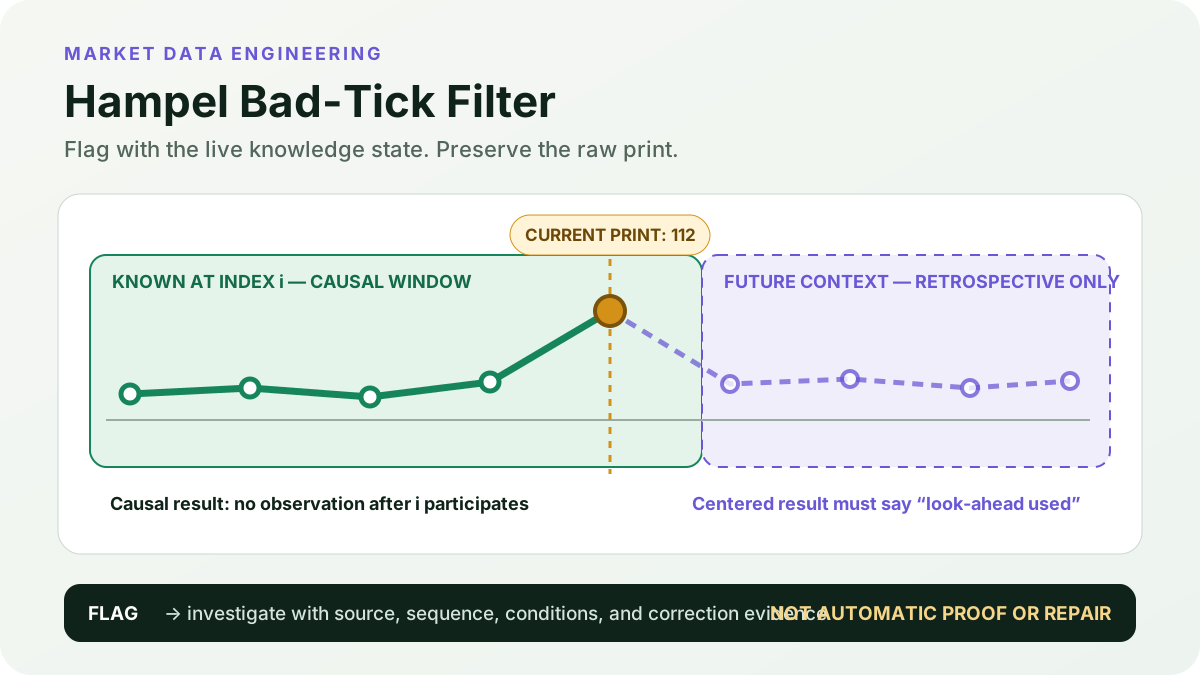
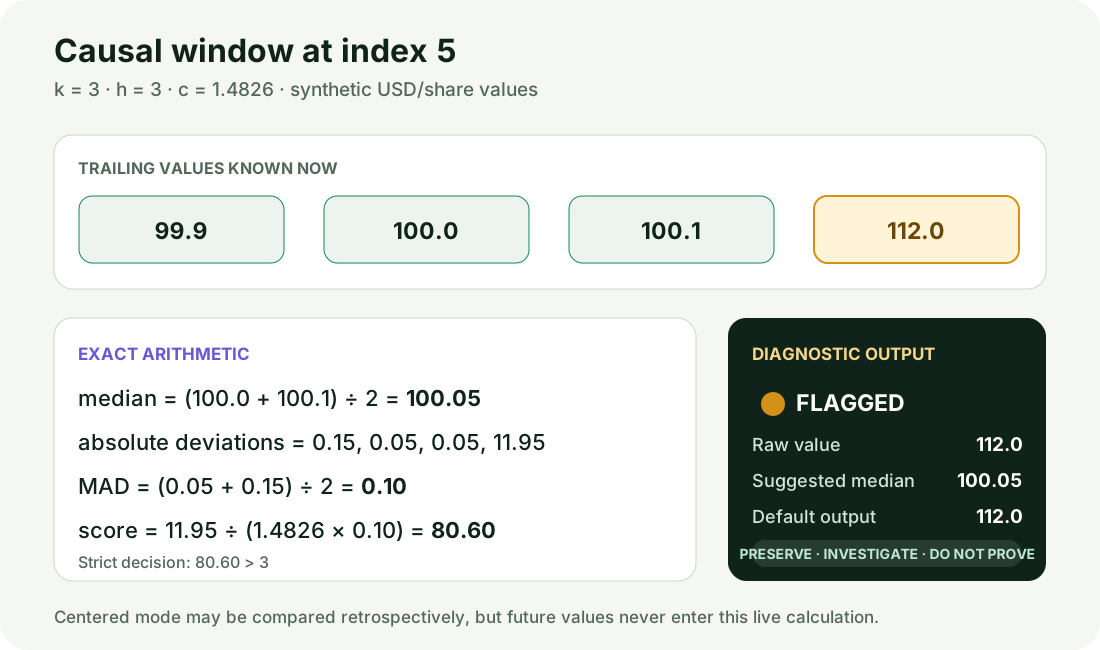
Calculation flow#
Hampel diagnostic, evidence, and policy flow
flowchart LR
    A["Ordered eligible tick"] --> B{"Window mode"}
    B -->|"Causal default"| C["Trailing values through i"]
    B -->|"Centered retrospective"| D["Past and future values around i"]
    C --> E["Median, MAD, score"]
    D --> E
    E --> F["Flag plus diagnostics"]
    F --> G{"Independent evidence"}
    G -->|"Unconfirmed"| H["Preserve and investigate"]
    G -->|"Authorized policy"| I["Annotate or derive replacement"]
How it works#
This page states the contract — how to call it correctly. The article explains the concept: why it works, and where it breaks.
References#
- The Influence Curve and Its Role in Robust Estimation — Frank R. Hampel, ETH Zürich
- Median Absolute Deviation — National Institute of Standards and Technology
- Detection of Outliers — National Institute of Standards and Technology
- Generalized Hampel Filters — Ronald K. Pearson, Yrjö Neuvo, Jaakko Astola, Moncef Gabbouj
- Daily TAQ Client Specifications — New York Stock Exchange
- Evidence and data note