Scatter Plots, Association, and Nonlinear Patterns
Install and import#
npm install fintech-algorithmsimport { scatterPlotsAssociationAndNonlinearPatterns } from "fintech-algorithms/foundations/dependence-regression-and-model-foundations/scatter-plots-association-and-nonlinear-patterns";Signature#
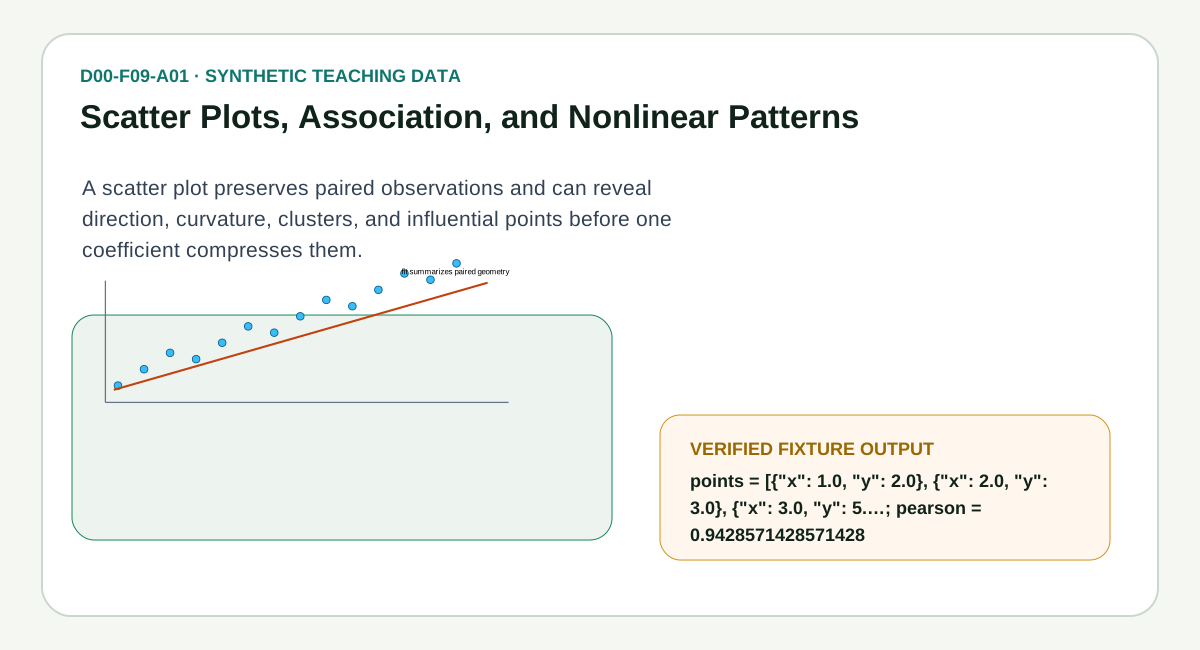
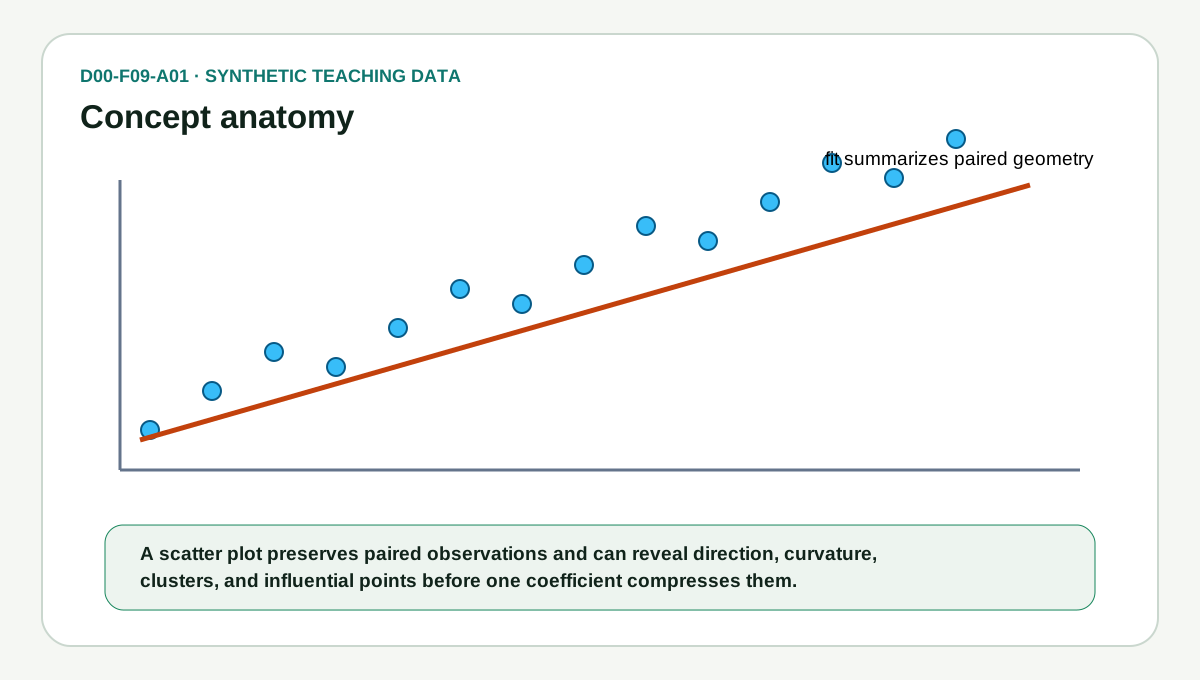
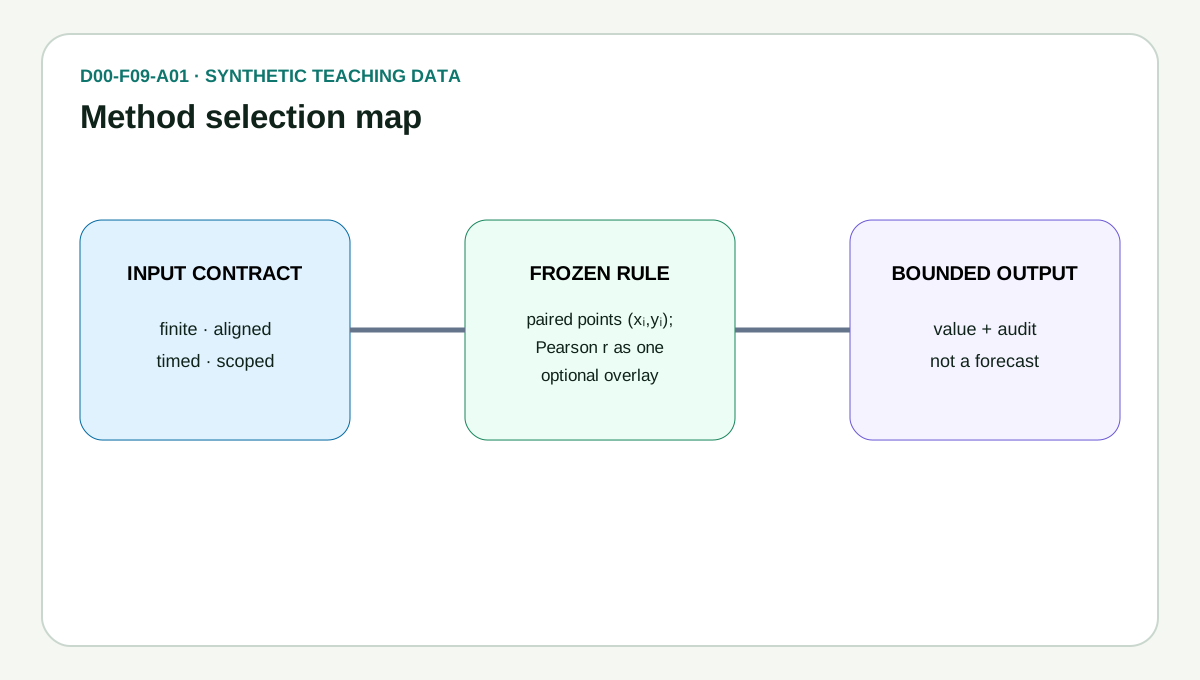
scatterPlotsAssociationAndNonlinearPatterns(input)Pairs input.x and input.y into plottable points and reports the Pearson correlation over them along with its sign.
Parameters#
| Name | Type | Notes |
|---|---|---|
input | D00Input | One record holding the two aligned series x and y, one observation per position.x: non-empty list of finite numbers, at least two, not all identical · y: finite numbers, same length as x |
Returns#
D00Output
An object with points (one { x, y } entry per observation), pearson (the correlation) and monotonicDirection, which reads positive when the correlation is above zero and negative otherwise.
Errors#
- When x or y is missing, empty, or contains a non-finite number — throws RangeError
- When x and y have different lengths, or fewer than two observations — the least-squares fit is computed for every topic in the family before the topic branch is taken — throws RangeError
- When x is constant, which leaves the regression slope undefined — throws RangeError
- When y is constant, which leaves the correlation undefined — throws RangeError
Complexity: time O(n),
space O(n).
Worked example#
verified This is the worked example published in the article, replayed by the test suite on every run. The output cannot drift.
Input#
{
  "x": [1, 2, 3, 4, 5, 6],
  "y": [2, 3, 5, 4, 6, 7],
  "groups": ["A", "A", "A", "B", "B", "B"],
  "predictX": 7,
  "otherPredictor": [2, 4, 5, 8, 9, 13]
}Call#
scatterPlotsAssociationAndNonlinearPatterns(input)Returns#
object with 2 fields: points, pearson
{
  "points": [
    {
      "x": 1,
      "y": 2
    },
    {
      "x": 2,
      "y": 3
    },
    {
      "x": 3,
      "y": 5
    }
  ],
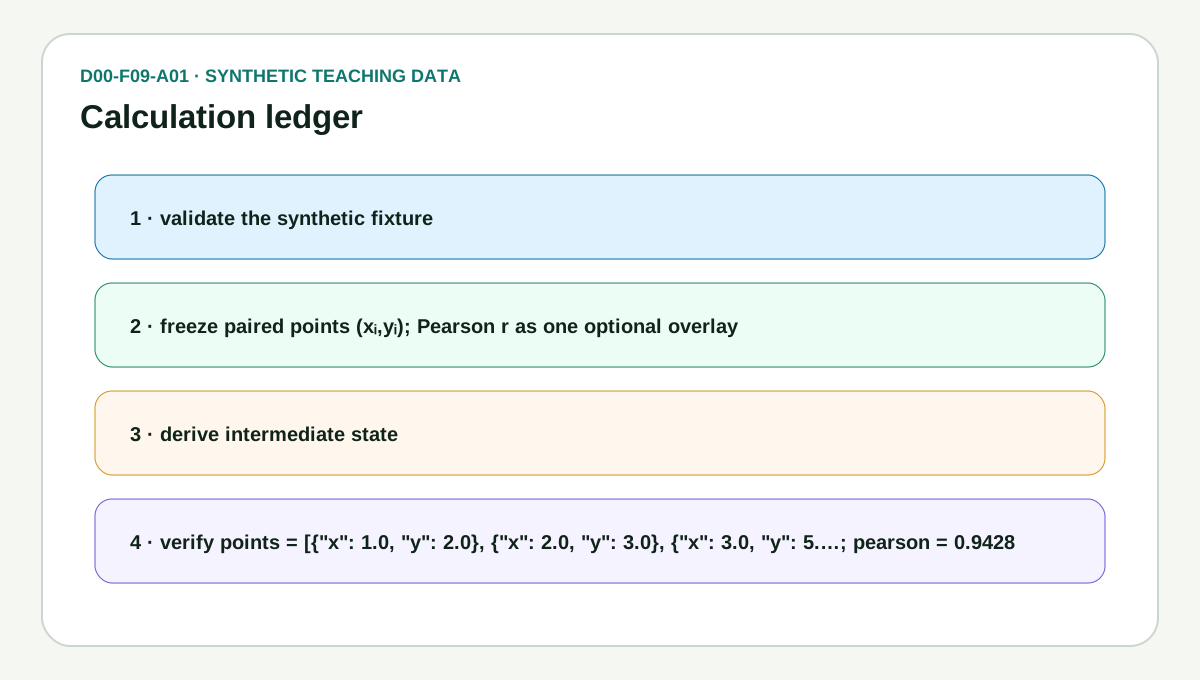
  "pearson": 0.9428571428571428
}Diagrams#
Calculation flow#
Reasoning flow — D00-F09-A01
flowchart LR
    A["Synthetic input + metadata"] --> B{"Contract valid?"}
    B -->|No| C["Reject or route with reason"]
    B -->|Yes| D["Apply Scatter Plots, Association, and Nonlinear Patterns"]
    D --> E["Formula: paired points (xᵢ,yᵢ); Pearson r as one optional overlay"]
    E --> F["Verified fixture output"]
    F --> G{"Interpretation within boundary?"}
    G -->|Yes| H["Report value + convention + audit"]
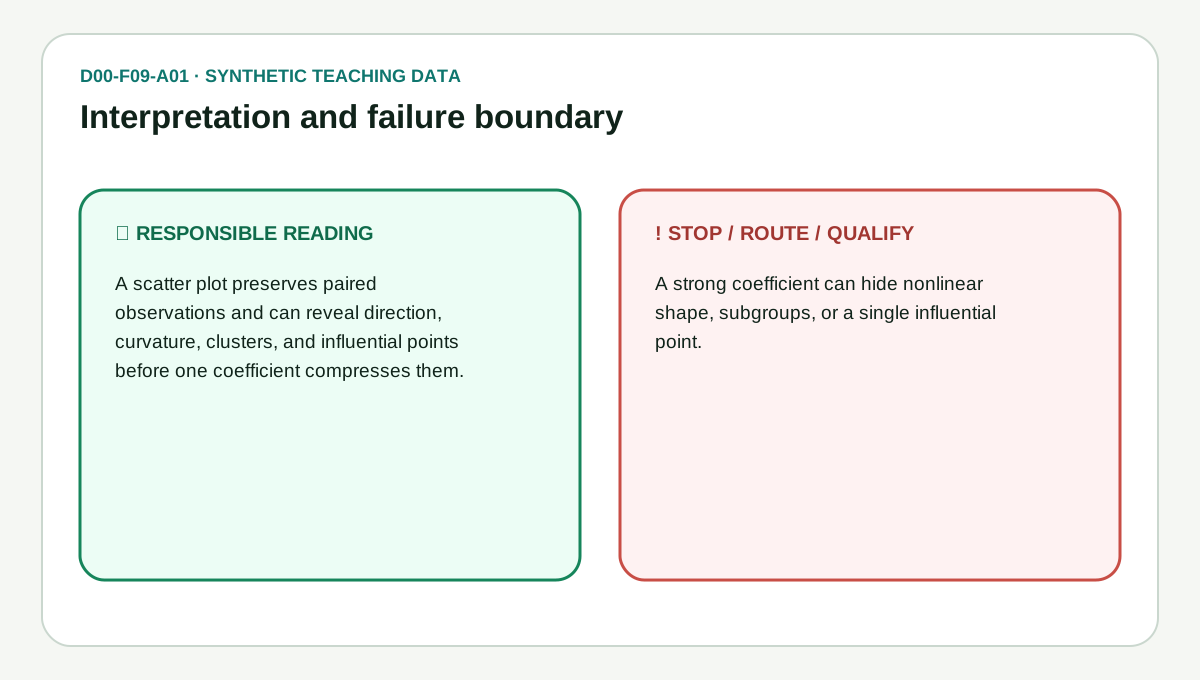
    G -->|No| I["Add companion view or narrower claim"]
How it works#
This page states the contract — how to call it correctly. The article explains the concept: why it works, and where it breaks.
References#
- Linear Least Squares Regression — NIST/SEMATECH e-Handbook
- Correlation — NIST/SEMATECH e-Handbook
- Historical-example decision