Forecast-Error Variance Decomposition
Install and import#
npm install fintech-algorithmsimport { forecastErrorVarianceDecomposition } from "fintech-algorithms/statistical-time-series/multivariate-systems/forecast-error-variance-decomposition";Signature#
forecastErrorVarianceDecomposition(coefficients, sigmaU, horizon, impactMatrix)Attributes each variable's forecast error variance to the structural shocks, by horizon. Answers 'how much of the movement in this variable is explained by that one' — subject, again, to the identification.
Parameters#
| Name | Type | Notes |
|---|---|---|
coefficients | number[][] | VAR coefficient matrices. |
sigmaU | number[][] | Residual covariance matrix. |
horizon | number | Periods to decompose. min: 1 · integer: true |
impactMatrix | Matrix | Contemporaneous impact matrix. Defaults to the lower Cholesky factor of sigmaU, which is the recursive identification implied by variable order.optional |
Returns#
{ shares, impact_matrix, horizon, row_sums, companion_spectral_radius, stability_state, … }
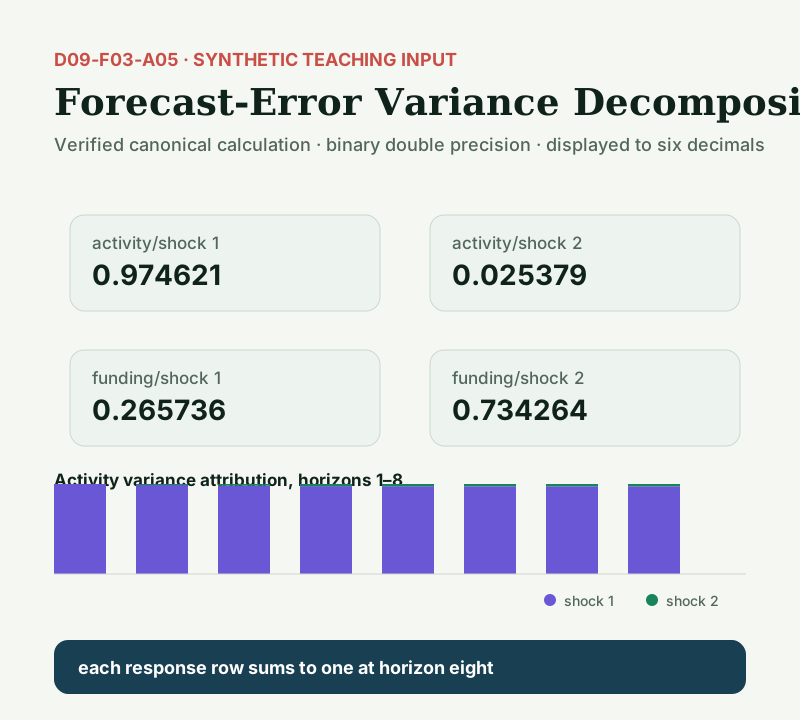
Variance shares with row_sums — each row should sum to 1, and reporting it makes a broken decomposition obvious rather than plausible.
Errors#
- When sigmaU is not symmetric positive definite — throws
Complexity: time O(horizon × k³),
space O(horizon × k²).
Worked example#
executed Captured by running this function on the input its own test provides. Real output of real code — but not asserted against a published figure.
Input#
[
  [
    [0.55, 0.18],
    [-0.12, 0.42]
  ]
][
[0.64, 0.28],
[0.28, 0.425]
]8[
[0.8, 0],
[0.35, 0.55]
]Call#
forecastErrorVarianceDecomposition(coefficients, sigmaU, horizon, impactMatrix)Returns#
object with 10 fields: shares, impact_matrix, horizon, row_sums, companion_spectral_radius, stability_state, stability_boundary, near_boundary_threshold, …
{
  "shares": [
    [
      [1, 0],
      [0.288235294118, 0.711764705882]
    ],
    [
      [0.989143895172, 0.010856104828],
      [0.260105787983, 0.739894212017]
    ],
    [
      [0.980857224422, 0.019142775578],
      [0.258546673098, 0.741453326902]
    ]
  ],
  "impact_matrix": [
    [0.8, 0],
    [0.35, 0.55]
  ],
  "horizon": 8,
  "row_sums": [
    [1, 1],
    [1, 1],
    [1, 1]
  ],
  "companion_spectral_radius": 0.502593274925,
  "stability_state": "stable",
  "stability_boundary": 1,
  "near_boundary_threshold": 0.9,
  "state": "computed",
  "reason": "orthogonalized-squared-response-share"
}
Other exports#
This module also exports
companionMatrix, companionSpectralRadius, fitVAR, choleskyLower, fitRecursiveSVAR, fitVECMFixedBeta, movingAverageMatrices, impulseResponses. Every module additionally exports run as an alias of its
primary function, and a meta object carrying its catalog id, domain, family,
shape and article URL.
Diagrams#
Calculation flow#
Forecast-Error Variance Decomposition system flow
flowchart LR
    A["Identified response matrices"] --> B["Square each contribution"]
    B --> C["Accumulate through horizon"]
    C --> D["Normalize within response row"]
    D --> E["Shares sum to one"]
How it works#
This page states the contract — how to call it correctly. The article explains the concept: why it works, and where it breaks.
References#
- statsmodels vector autoregression documentation — statsmodels developers
- statsmodels Forecast-Error Variance Decomposition API documentation — statsmodels developers
- Generalized Forecast Error Variance Decomposition for Linear and Nonlinear Multivariate Models — Markku Lanne and Henri Nyberg
- New Introduction to Multiple Time Series Analysis — Helmut Lütkepohl
- Macroeconomics and Reality — Christopher A. Sims
- Statistical Analysis of Cointegration Vectors — Søren Johansen
- Publication boundary