Close-to-Close Volatility
Install and import#
npm install fintech-algorithmsimport { calculate } from "fintech-algorithms/volatility-and-covariance/historical-estimators/close-to-close-volatility";Signature#
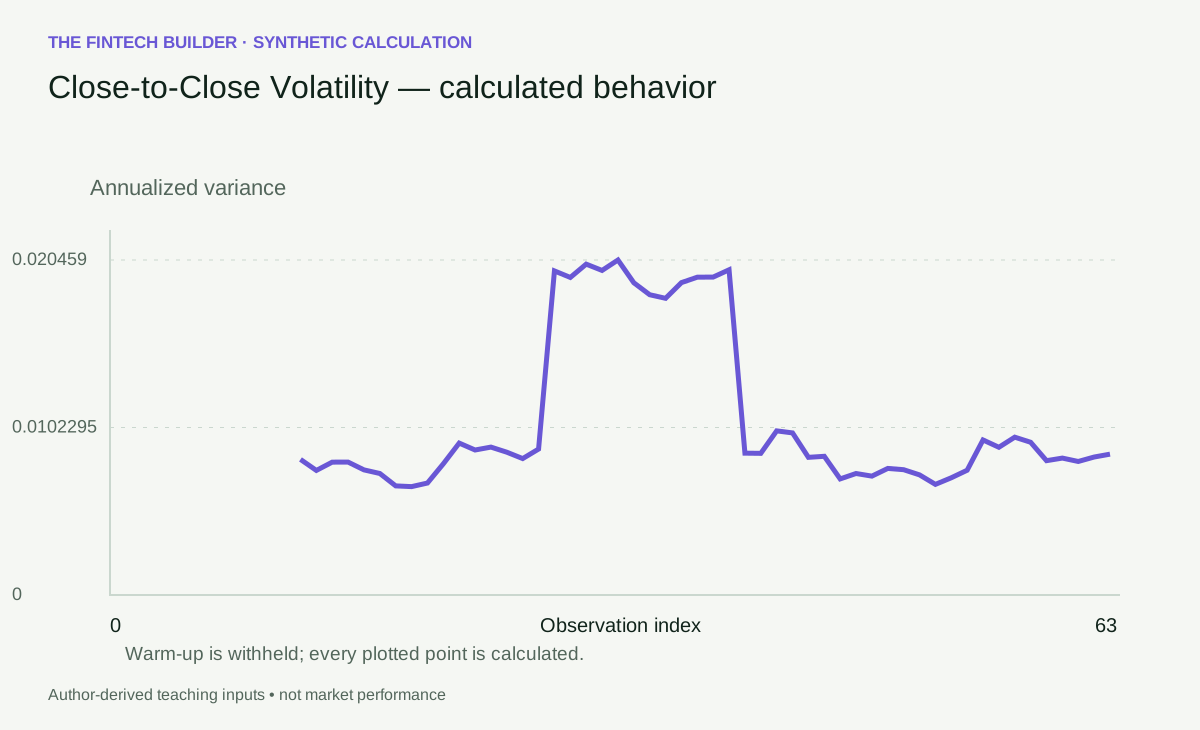
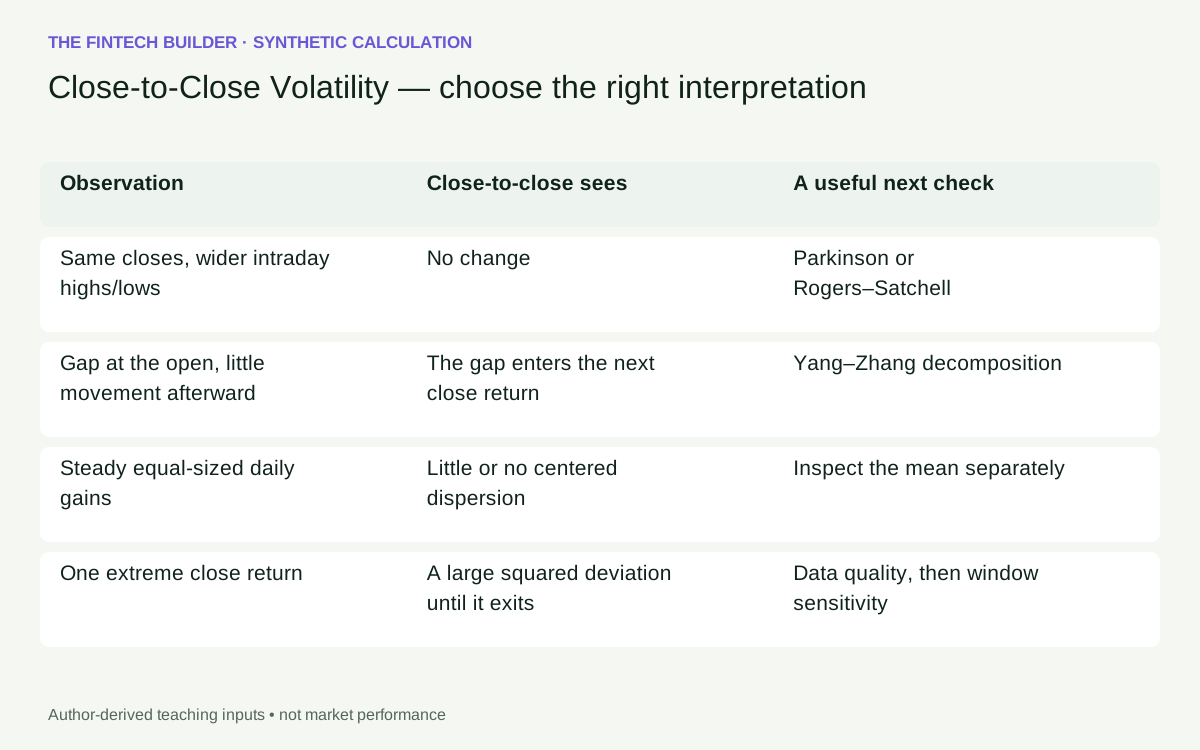
calculate(data)Observe a close shock enter and leave centered return dispersion. Supplied-parameter educational reference; no fitted performance claim.
Parameters#
| Name | Type | Notes |
|---|---|---|
data | TopicInput | See data-contract/CONTRACT.md. |
Returns#
TopicResult
Structured result with readiness, values, parameters, and diagnostics.
Warm-up#
The first depends on window or model order positions are null prefix until minimum history exists.
Errors#
- When required data is missing, non-finite, malformed, or out of range — raises ContractError / Error
Complexity: time O(nw),
space Full diagnostic trace retained for teaching; see implementation for observation/window/matrix dimensions.
Worked example#
executed Captured by running this function on the input its own test provides. Real output of real code — but not asserted against a published figure.
Input#
{
  "bars": [
    {
      "timestamp": "2026-01-01T09:00:00Z",
      "open": 99.50124791926824,
      "close": 100,
      "high": 101.00501670841679,
      "low": 98.51119396030626
    },
    {
      "timestamp": "2026-01-02T09:00:00Z",
      "open": 100.5012520859401,
      "close": 101.00501670841679,
      "high": 102.02013400267558,
      "low": 99.50124791926824
    },
    {
      "timestamp": "2026-01-03T09:00:00Z",
      "open": 98.51119396030626,
      "close": 99.0049833749168,
      "high": 100,
      "low": 97.53099120283326
    }
  ],
  "parameters": {
    "window": 2,
    "annualization_factor": 1
  }
}Call#
calculate(data)Returns#
object with 8 fields: topic_id, title, parameters, series, latest, ready, ready_at, diagnostics
{
  "topic_id": "D10-F01-A01",
  "title": "Close-to-Close Volatility",
  "parameters": {
    "window": 2,
    "annualization_factor": 1
  },
  "series": [
    null,
    null,
    {
      "timestamp": "2026-01-03T09:00:00Z",
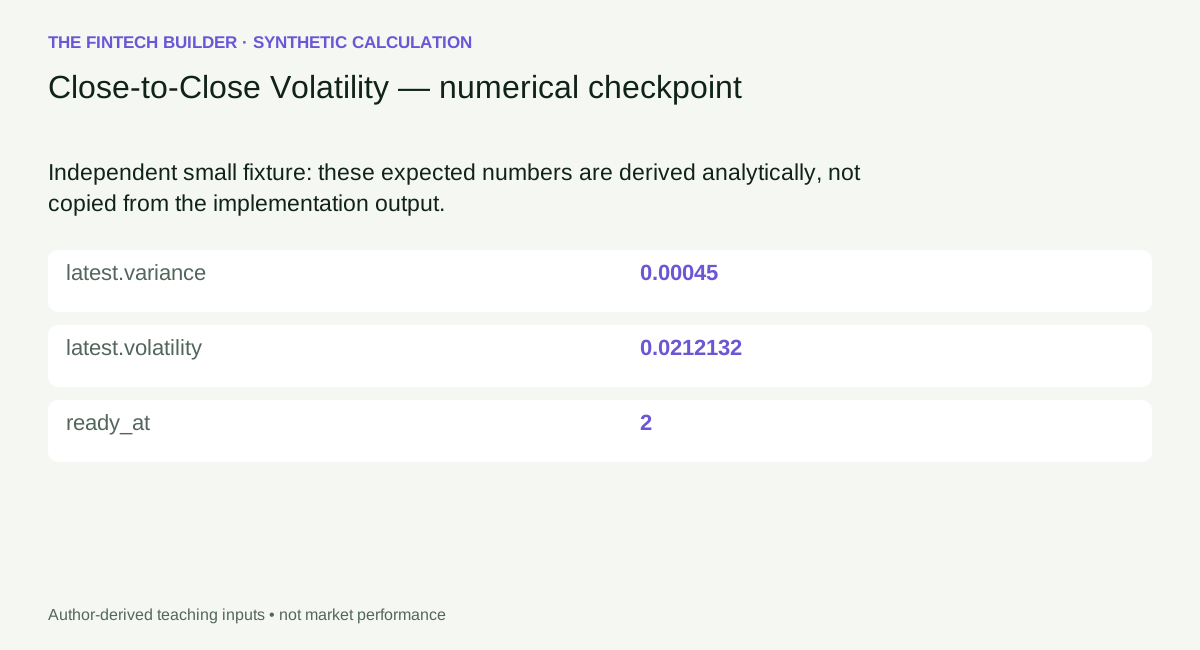
      "variance": 0.0004499999999999914,
      "volatility": 0.021213203435596222,
      "contributions": [0.009999999999999893, -0.019999999999999823],
      "components": {},
      "window_start": 1,
      "window_end": 2
    }
  ],
  "latest": {
    "timestamp": "2026-01-03T09:00:00Z",
    "variance": 0.0004499999999999914,
    "volatility": 0.021213203435596222,
    "contributions": [0.009999999999999893, -0.019999999999999823],
    "components": {},
    "window_start": 1,
    "window_end": 2
  },
  "ready": true,
  "ready_at": 2,
  "diagnostics": {
    "input_count": 3,
    "annualization_factor": 1,
    "causal": true
  }
}Diagrams#
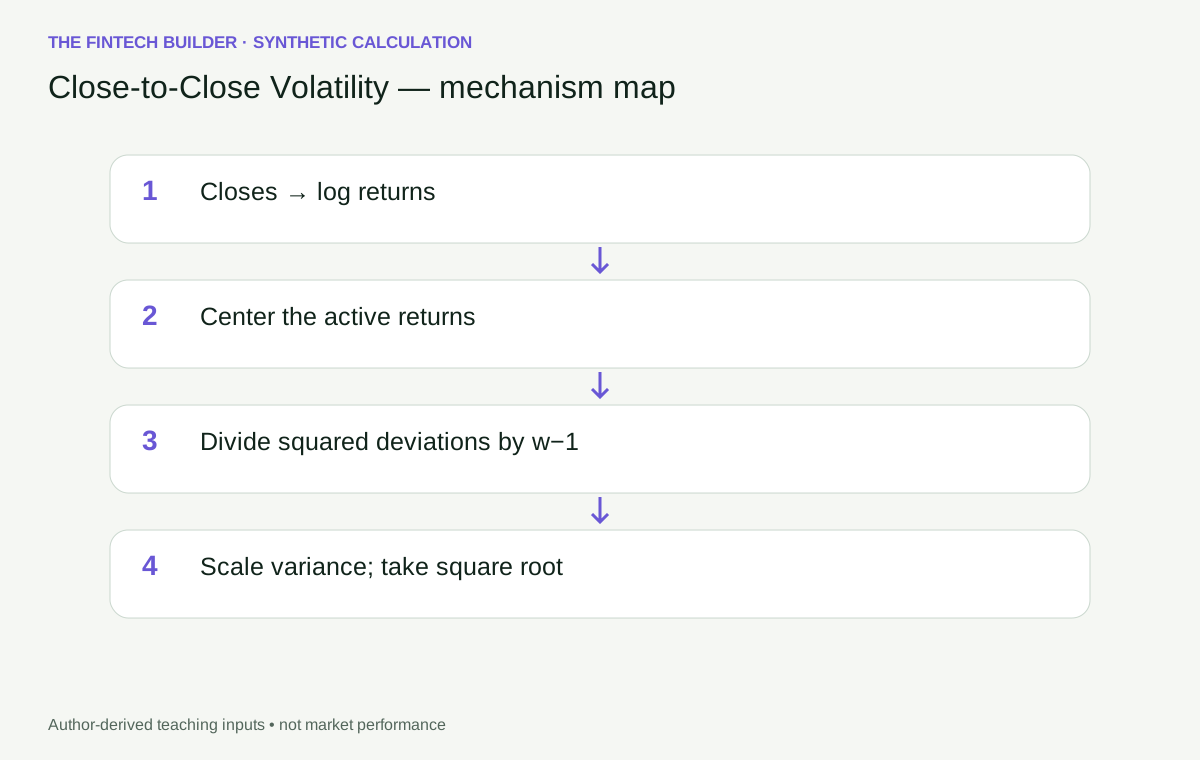
Calculation flow#
Close-to-Close Volatility — calculation-flow
flowchart TD
    N0["Closes → log returns"]
    N1["Center the active returns"]
    N2["Divide squared deviations by w−1"]
    N3["Scale variance; take square root"]
    N0 --> N1 --> N2 --> N3
Close-to-Close Volatility — decision-boundary
flowchart TD
    A["Supplied observations and parameters"] --> B{"Contract valid?"}
    B -->|No| E["Reject with explicit error"]
    B -->|Yes| C{"Required history available?"}
    C -->|No| W["Withhold; never insert zero"]
    C -->|Yes| D["Close-to-Close Volatility calculation"]
    D --> F["Inspect diagnostics and stated limits"]
How it works#
This page states the contract — how to call it correctly. The article explains the concept: why it works, and where it breaks.
References#
- Scope of evidence