Hierarchical Risk Parity
Install and import#
npm install fintech-algorithmsimport { hierarchicalRiskParityWeights } from "fintech-algorithms/portfolio-construction/risk-allocation/hierarchical-risk-parity";Signature#
hierarchicalRiskParityWeights(assetIds, covariance)Allocates capital by clustering assets on a correlation-derived profile distance, then splitting capital down the tree by branch variance, without inverting the covariance matrix.
Parameters#
| Name | Type | Notes |
|---|---|---|
assetIds | readonly unknown[] | |
covariance | readonly unknown[] |
Worked example#
executed Captured by running this function on the input its own test provides. Real output of real code — but not asserted against a published figure.
Input#
["A", "B", "C", "D"][
[0.04, 0.036, 0.004, 0.002],
[0.036, 0.04, 0.003, 0.001],
[0.004, 0.003, 0.01, 0.008]
]Showing 3 of 4 elements.
Call#
hierarchicalRiskParityWeights(assetIds, covariance)Returns#
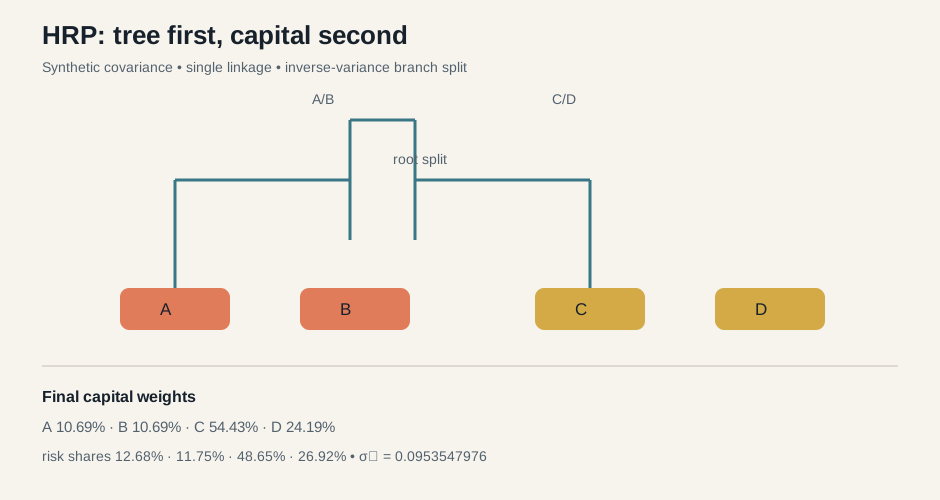
object with 18 fields: assetIds, weights, componentRiskContributions, componentRiskShares, portfolioVariance, portfolioVolatility, sumWeights, quasiDiagonalOrder, …
{
  "assetIds": ["A", "B", "C", "D"],
  "weights": [
    0.10688050930460334,
    0.10688050930460334,
    0.5443192948090109,
    0.2419196865817826
  ],
  "componentRiskContributions": [
    0.012087521651000223,
    0.01120624850215681,
    0.046390190600378356,
    0.025670836878125575
  ],
  "componentRiskShares": [
    0.12676364431805753,
    0.11752160122498084,
    0.4865008552540336,
    0.26921389920292804
  ],
  "portfolioVariance": 0.009092537431375017,
  "portfolioVolatility": 0.09535479763166098,
  "sumWeights": 1.0000000000000002,
  "quasiDiagonalOrder": [0, 1, 2, 3],
  "correlationMatrix": [
    [1, 0.8999999999999999, 0.2, 0.06666666666666667],
    [0.8999999999999999, 1, 0.15, 0.03333333333333333],
    [0.2, 0.15, 1, 0.5333333333333333]
  ],
  "distanceMatrix": [
    [0, 0.3170569112290949, 1.0116748865867387, 1.0853926811234083],
    [0.3170569112290949, 0, 1.030619181950856, 1.0983382141884035],
    [1.0116748865867387, 1.030619181950856, 0, 0.6863742401099239]
  ],
  "merges": [
    {
      "left": [0],
      "right": [1],
      "distance": 0.3170569112290949
    },
    {
      "left": [2],
      "right": [3],
      "distance": 0.6863742401099239
    },
    {
      "left": [0, 1],
      "right": [2, 3],
      "distance": 1.0116748865867387
    }
  ],
  "method": "hierarchical-risk-parity",
  "linkage": "single",
  "distance": "euclidean-distance-between-sqrt((1-correlation)/2)-profiles"
}
Showing 14 of 18 fields.
Diagrams#
Calculation flow#
HRP flow
flowchart LR
  A[Validate supplied covariance] --> B[Correlation rho]
  B --> C[Distance sqrt 2(1-rho)]
  C --> D[Single-linkage merge tree]
  D --> E[Quasi-diagonal leaf order]
  E --> F[Inverse-variance branch risks]
  F --> G[Recursive bisection]
  G --> H[Weights and signed risk contributions]
  I[Stale, split, FX, quantity evidence] -. upstream route .-> A
How it works#
This page states the contract — how to call it correctly. The article explains the concept: why it works, and where it breaks.